Opinion, Scientific Workforce, Future of Work

The Merriam-Webster Dictionary has several definitions for the word "society" but I think this one is a pretty good starting place:
"a community, nation, or broad grouping of people having common traditions, institutions, and collective activities and interests."
"a community, nation, or broad grouping of people having common traditions, institutions, and collective activities and interests."
An alternative definition of society "an enduring and cooperating social group whose members have developed organized patterns of relationships through interaction with one another" also seems appropriate for this post.
We are all embedded within and participants in a variety of societal systems that affect us everyday. These range from economic systems (Capitalism, Socialism, Communism) to governing systems (representative democracies, parliamentary democracies, autocracies) and employment sectors (higher education, healthcare, finance). The interesting thing about systems is that while they are ultimately constructed by choices made by people, many individuals don't feel like they have agency within them. It is as if past choices made by others in power or with influence set out the parameters and rules to which we must now operate within.
There have been growing critiques of many of our modern systems over the past several years including shareholder capitalism. These critiques have come largely from the young who feel the systems of the past aren't serving them well (and they may have valid points there).
It is possible that some critics of our systems were always present and that social media and the internet now allow for ideas to reach wider audiences and elevate long-held but "fringe" views into the mainstream. Regardless of the reasons this discontent has boiled to the surface, we should not simply ignore or dismiss it.
Unhappy & Disillusioned Youth
Gallup's World Happiness Report 2024 reveals some striking findings: among those below the age of 30, the United States ranks 62nd and Canada 58th in global happiness while among those age 60 and above, the US ranks 10th and Canada 8th in global happiness. Put another way, older adults in the US & Canada fall in the top 7% of countries in their happiness ratings while youth are in the 40th percentile or lower. This dichotomy between the perception of youth and older adults is also present in other high-income democratic countries including Japan (gap between young and older adults of 37 places), Germany (gap of 26 places), Spain (gap of 26 places), and France (gap of 23 places) and to a lesser degree Australia (gap of 10 places) and the United Kingdom (gap of 12 places).
One potential explanation for this unhappiness in the young is we are in a time of immense change and uncertainty and this has led to heightened anxiety and depression, most likely enhanced by social media platforms.
Additionally, it is difficult to argue with the notion that older individuals took advantage of economic cycles that allowed for their wealth and prosperity to grow in most of the capitalistic, democratic, neoliberal world order that emerged post World War II and reached new heights in the 1980s & 1990s. In fact, according to data from the United State's Federal Reserve, US Baby Boomers and older adults now hold more wealth than the rest of the population (those aged 55+ hold ~69% of US wealth compared with ~9% of wealth held by those under age 40). The rise of globalism as a potential driver of the disconnect between happiness amongst older adults and youth may be best seen in the Gallup World Happiness Report's data from China (a large beneficiary of globalization during the 1990s and early 2000s) where the gap in happiness is on par with the US and Canada (gap of 49 places) with Chinese youth in the 55th percentile (just ahead of Libya) while older Chinese are in the top 25% of countries (just behind Spain) for happiness. The rise of the Chinese Gen Z trend of "lying flat" epitomizes the fact that this youth discontent is not limited to democracies but perhaps a wider trend of modern society.
The data are clear that youth disillusionment is on the rise across the globe and in 2021 the World Economic Forum went as far as to name it one of the top global risks. The report defines youth disillusionment as "youth disengagement and lack of confidence and/or trust with existing economic, political, and societal structures at a global scale" and that the consequence of its rise is "negatively impacting social stability, individual well-being, and economic productivity".
What one defines as "youth" is somewhat subjective but a global study found that Millennials, the generation born between 1981 and 1996 - with some now entering their 40s, are the most dissatisfied with democracy and more dissatisfied than Generation X or Baby Boomers were at the same age. The work also found a generation gap in satisfaction with democracy where on average Baby Boomers were more satisfied than Generation X who were more satisfied than Millennials. The report referenced above did not look at the newest generation to enter the workforce - Generation Z - but data released by Gallup in Fall 2023 suggest their faith in a variety of institutions in the United States is exceedingly low (50% indicate very little trust in Congress, 46% in the Presidency).
The lack of confidence in our societal systems and overall disillusionment of younger generations is a big problem. The young people of today are the future workforce of tomorrow, ultimately paying taxes that help keep our countries and their various entitlement programs running.

The System of Higher Education & The Academic Workforce
I work in the interesting "system" that is higher education and a research-intensive university, specifically. While many in the general public may believe higher education is more morally pure in its motives than, say, a for-profit corporation, this does not mean these institutions don't possess various hierarchies and power dynamics.
One point to remember about most social systems is they are constructed by people, specifically by those who are actively engaged in a common ideal or area of work. So, the system of higher education was created by academics and their choices over many years. These led to a variety of norms and attitudes they may seem to many today as "assumed" or as "the way we have always done things" but often those embedded deep in a social system lack perspective on said system. They only know what they have experienced or learned vicariously through others (mentors or peers). Alternatives to the status quo can be hard to see from within a system. Additionally, most systems provide security and power to incumbents and established entities within them (tenured professors in the case of higher education) and these incumbents thus have many incentives present that make it difficult for them to be for change.
Why change a system that is working for you? Well, one reason could be that if a system becomes too exploitive or unequal individuals will at a minimum not want to participate in it and in extreme cases decide the only solution is to completely destroy it in its current form (the "burn it all down" approach). Furthermore, unhappy individuals within a system can lead to poorer outcomes for everyone including coworkers, collaborators, and the individuals the system serves (in the case of higher education, undergraduate students).
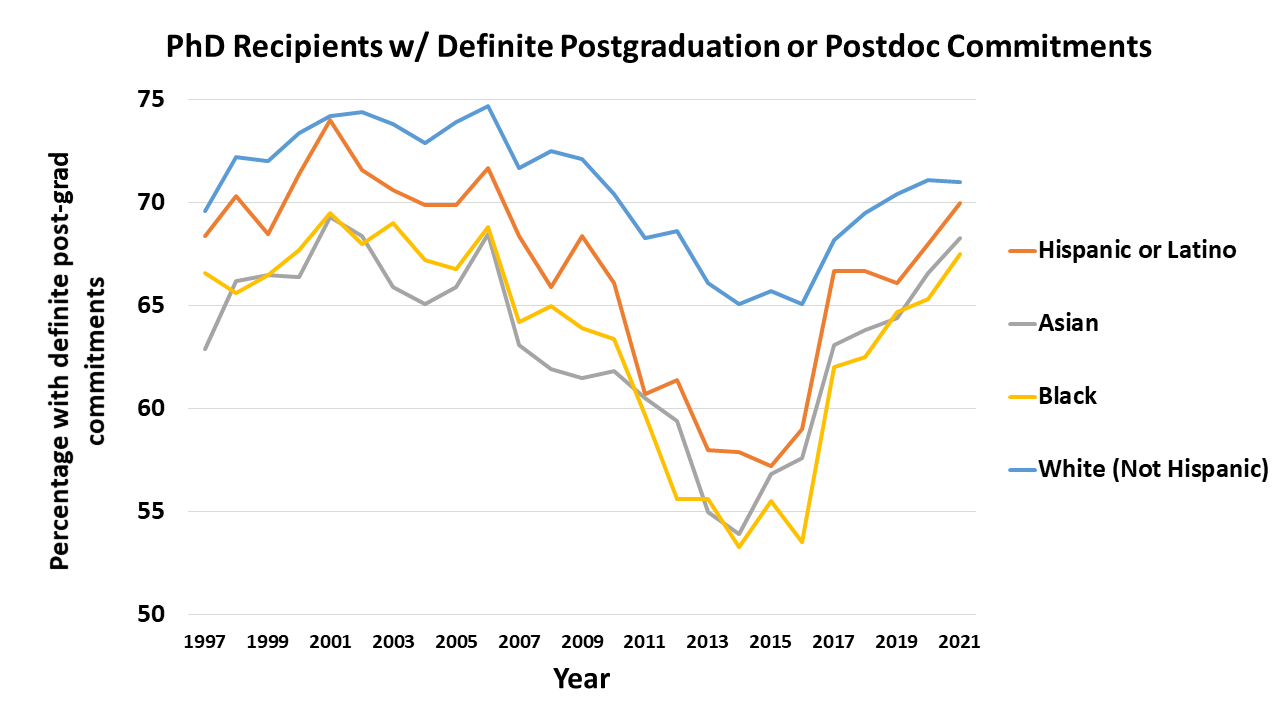
Big challenges face one group in the academy whom I have worked to support the past 5+ years: postdoctoral associates (postdocs). For those unfamiliar, a postdoc is an individual with a doctoral degree (often a Ph.D.) who embarks on a continued period of growth and development (somewhat akin to a residency for those with MD degrees). Traditionally, this period served as an apprenticeship where a newly-minted Ph.D. would work "under" a more senior scholar/researcher to learn the skills required to become an effective faculty member.
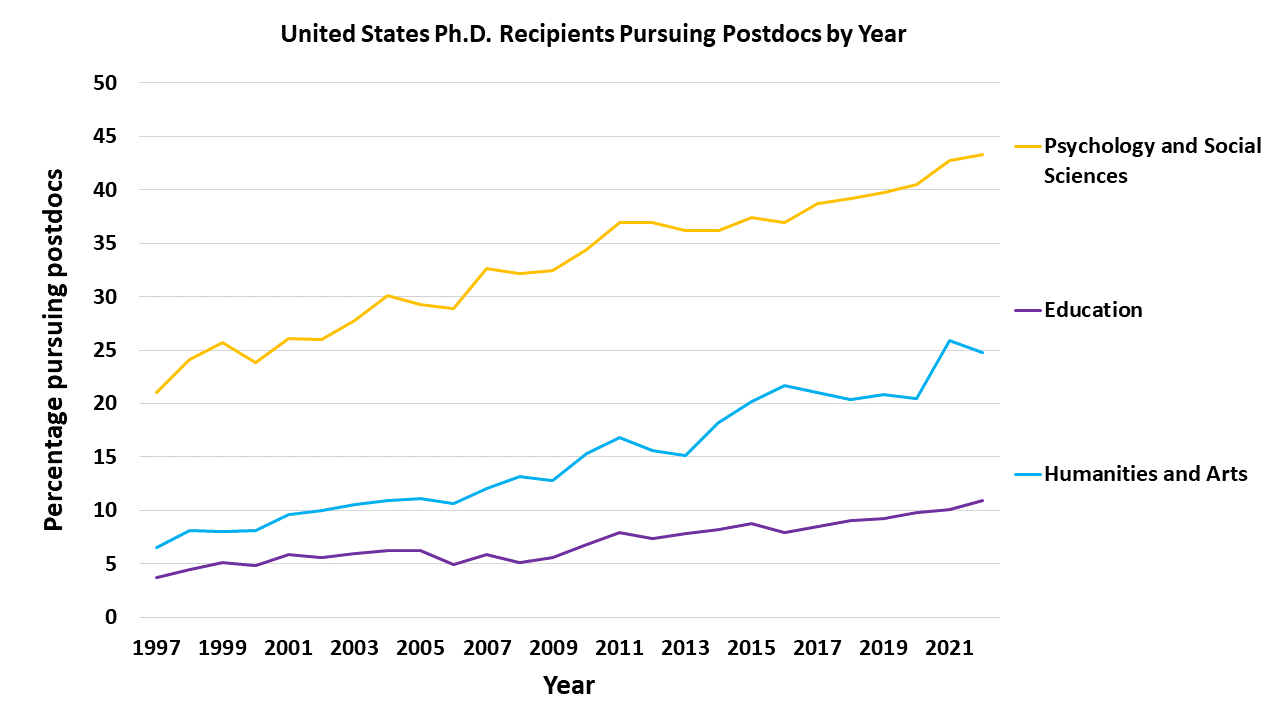
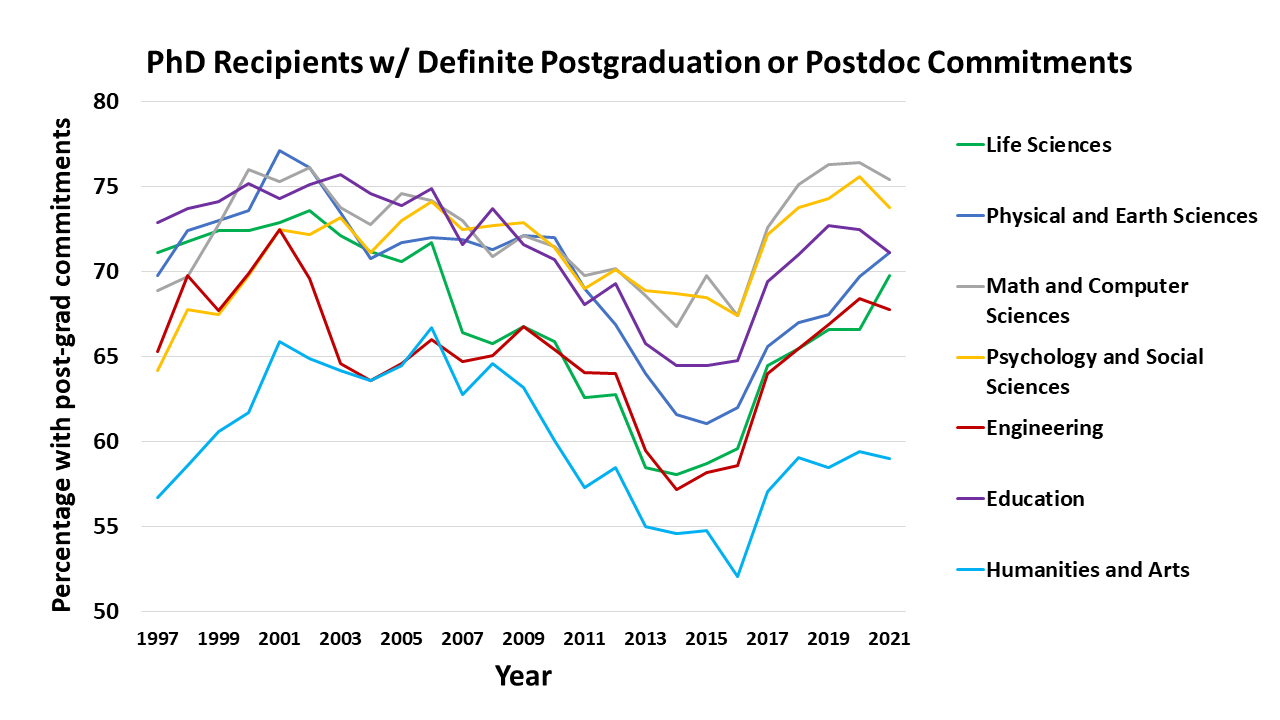
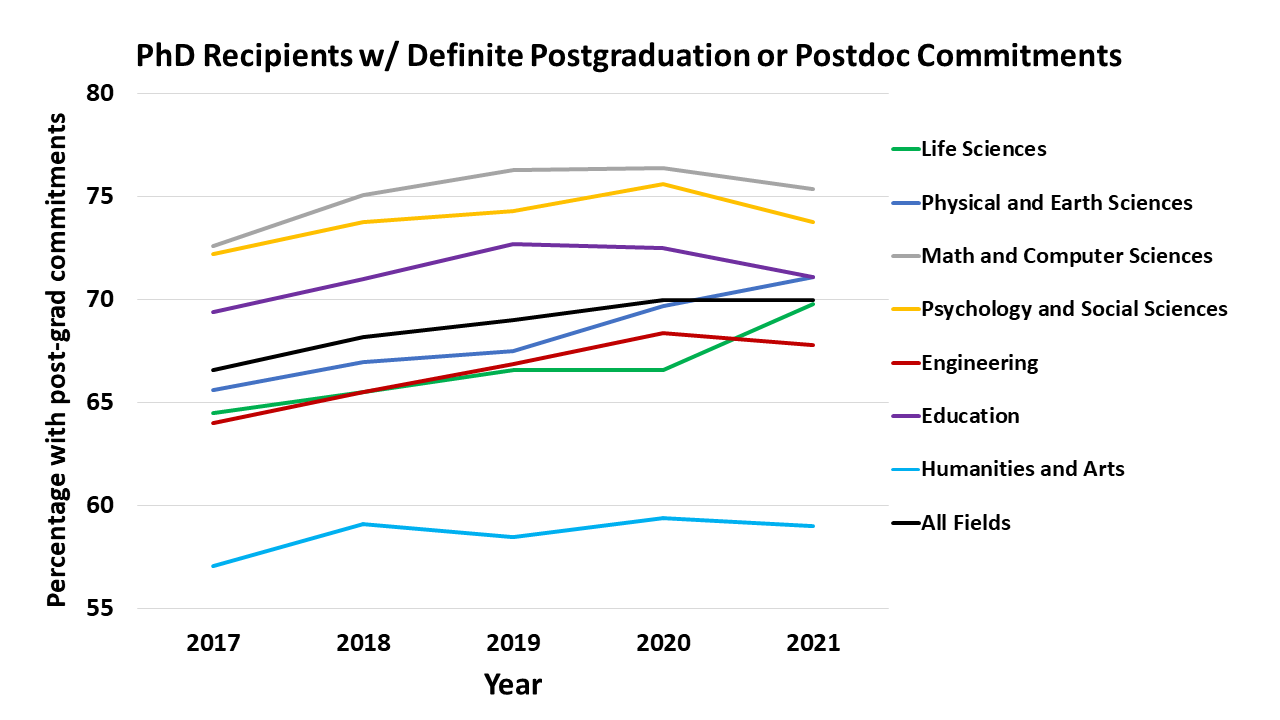
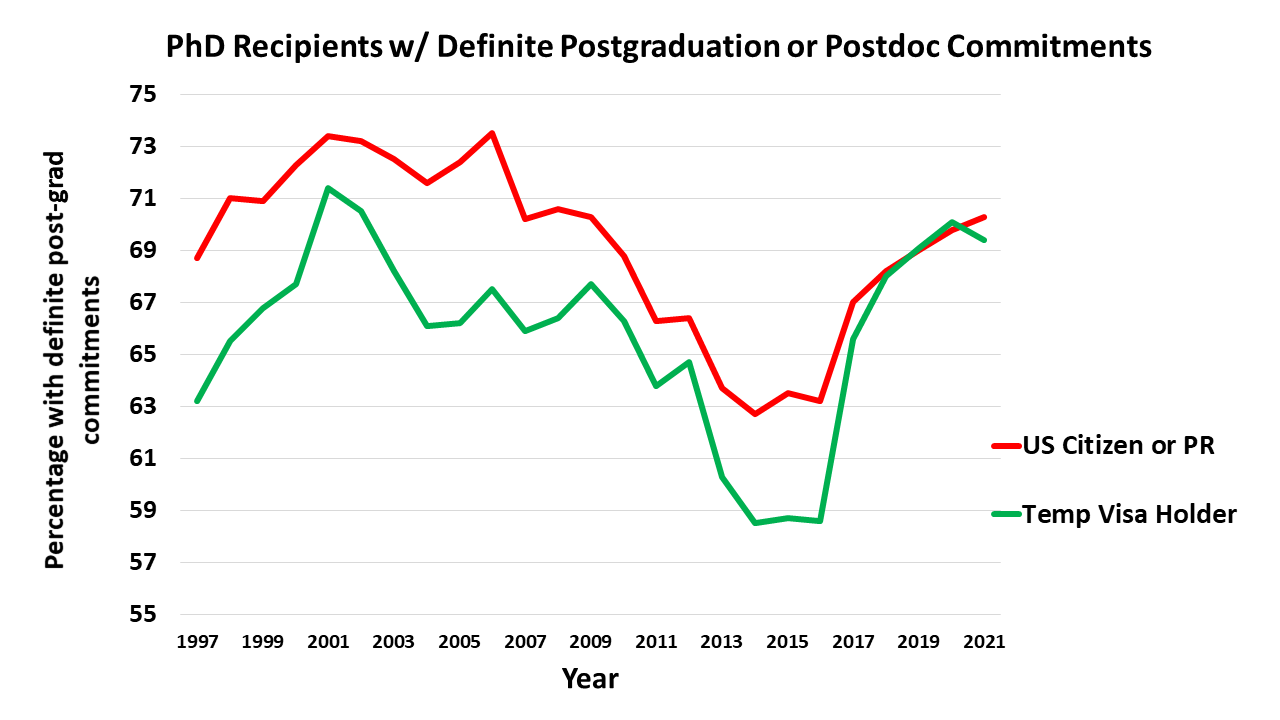
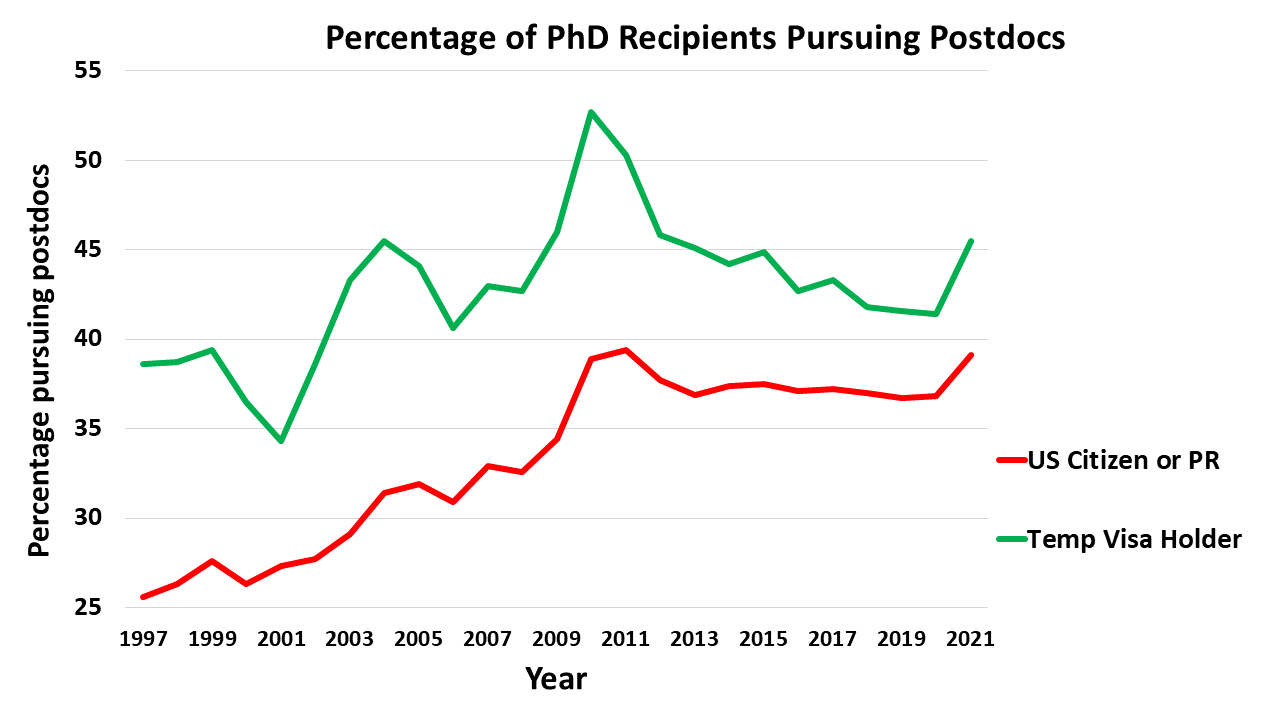
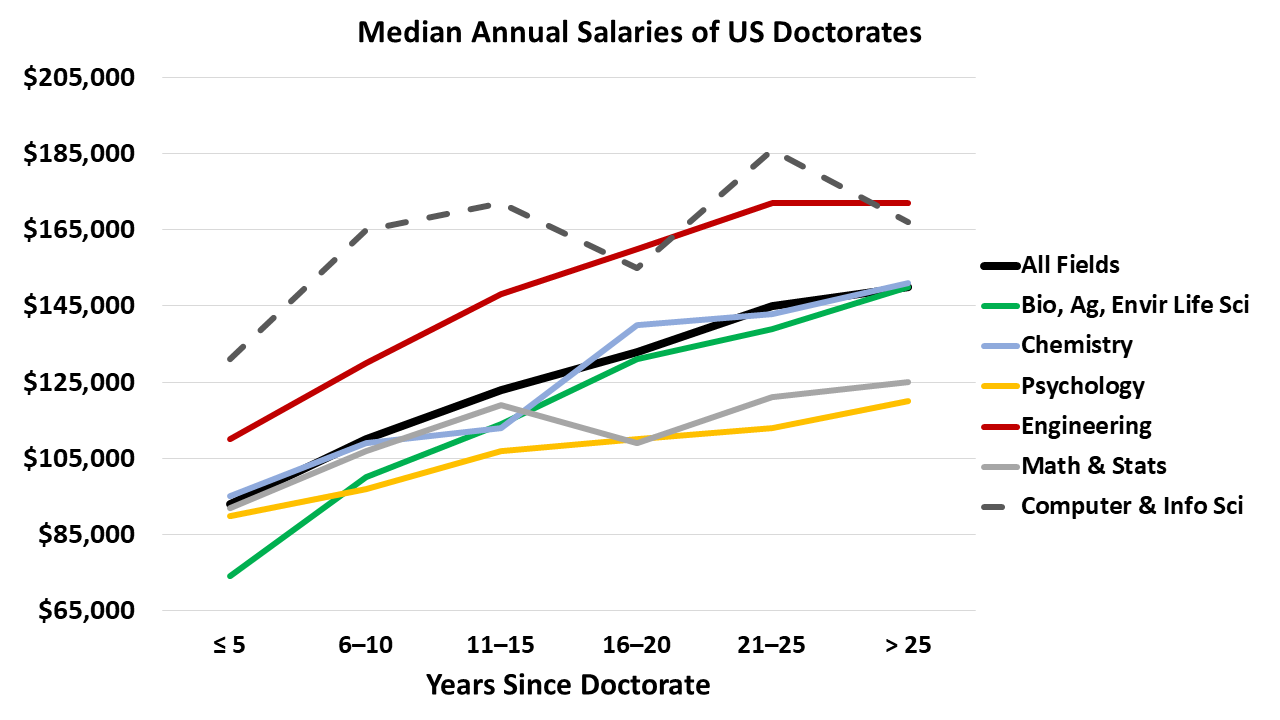
The challenge to the current state of the postdoc is that it is a relatively tenuous position with limited job security, relatively low pay, and little institutional support. Many in academia are concerned that conditions for postdocs are gotten to a point where less recent Ph.D.s pursue them and recent data suggest the number of postdocs is declining in the United States.
This has led to calls for change including the formation of a working group on Re-envisioning NIH-supported Postdoctoral Training, who submitted a set of recommendations to the NIH (National Institutes of Health) in December 2023. The National Postdoctoral Association (NPA) also recently released a new set of Recommended Postdoc Policies and Practices at its Annual Conference in mid-March 2024. Both documents call for a range of improvements to postdoc salaries, benefits, training environments, and processes to deal with and respond to problematic environments and working conditions.
It is great to see these calls for change but institutions will be slow to adapt.
Many postdocs (and graduate students) have taken matters into their own hands by banding together to pursue the formation of unions to help them more effectively advocate for their interests with institutional leadership. Given most postdocs are in the Millennial generation with Generation Z just now entering postdocs and making up a large portion of the graduate student ranks we might not be surprised by their activism and discontentment, given the points raised earlier from Gallup and the World Economic Forum on youth unhappiness and disillusionment. The topic of graduate student and postdoc unionization a complex one and not something I will get further into here. I will say, though, that certainly improved collective bargaining power can help with making conditions better for a group. The presence of union contracts and procedures could also lead to more adversarial relationships between parties or make academic relationships between students, postdocs, and faculty mentors more transactional and "employment-like" (though some might argue they have been this way anyway). Regardless of where one comes down on the topic of academic unionization, it is hard to argue that the push for it signals a growing discontent in key members of the ecosystem who feel unsupported and underappreciated. We must do better.
For more on graduate student and postdoc labor movements see: The panelists shared a variety of readings and resources which I highlight and add to, below:
- Organize the Lab: Theory and Practice
- Postdoc Identity, Jurisdictional Issues, Ideologies, and Unions: Considerations in Organizing Professionals
- Analyzing the Upward Trend in Academic Unionization: Drivers and Influences
- Journal of Collective Bargaining in the Academy
- An Analysis of Academic Hiring Research and Practice and a Lens for the Future: How Labor Justice Can Make a Better Academy

Systemic & Societal Change for a Better Tomorrow
In the end systems can be unjust and hard to change. This does not mean we shouldn't work to make our systems and society better. The challenge will be in convincing enough people that change will lead to improved outcomes for more stakeholders than the status quo.
How this change will come about also remains to be seen. I believe institutions that control the flow of resources (ie, money) will be critical to incentivize the change we want to see. For academic research those are large federal funding agencies like the National Science Foundation and National Institutes of the Health, which, to their credit, is pushing for better support of the graduate students and postdocs it directly funds through the NRSA fellowship programs. For larger issues of childcare, healthcare, and affordable housing, there is a role of the government incentivizing certain practices, for example the CHIPS and Science Act providing incentives tied to childcare benefits for employees.
Those with ability to advocate for change within a system will also be important. In academia, when tenured faculty mention the need to better support graduate students and postdocs, more people take notice. In the private sector, when a CEO pushes for better benefits and support for their employees, it usually happens. And workplaces seen as fairer report greater employee well-being and business success. Leadership and institutional commitment are often needed to push for change, including a willingness to move past seeing challenges as zero-sum but rather as opportunities to improve systems for the benefit of more people and, often, the long-term viability of an organization.
While anger at the state of our unequal societies and potentially unjust systems may be warranted, I am not for the "burn it all down" approach. Rather, I think we need to realize that the many individuals we could see as adversarial to our cause are, themselves, products of these systems. Sometimes they would like to see change but have been embedded so long in the status quo that they may be unable to see what could change about the environment. We also need to provide increased oversight and the ability for bad actors to be punished for activities that are clearly exploitative and egregious.
Change is hard but needed in higher education and beyond. We must work to restore faith in our societal institutions as they are critical to the functioning of a complex, interdependent nation and world. I surely don't have the answers but believe if enough voices are heard and we commit to collective action to improve our institutions, things can improve. This requires more active involvement in civic life, our communities, government, and non-profit organizations (which can also benefit you professionally while helping others) and doing the hard work that comes with volunteering in these areas, or even taking on causes outside your job description at your employer. And I would argue it requires young people to get more involved in these efforts to make sure their concerns and viewpoints are heard.
As the famous quote from Margaret Mead says:
"Never doubt that a small group of thoughtful, committed citizens can change the world. Indeed, it's the only thing that ever has."
"Never doubt that a small group of thoughtful, committed citizens can change the world. Indeed, it's the only thing that ever has."
To return to the definitions of society I started this post with: we must work to find common and collective activities and interests amongst diverse groups of stakeholders and generations AND realize that our society endures through cooperation. We each must do our part while also being willing to admit that all actions and approaches may not benefit us directly but that does not mean they aren't what is best for the greater good.
More from the Blog:
Additional readings & resources:
- All Together: How Inclusivity and Community Can Foster Increased Innovation and a Better Future
- Precarity, Competition, and Innovation: How Economic Systems and Societal Structures Shape Our Future
- Dedication
Additional readings & resources:
- War on the Young (blog post by Scott Galloway)
- Faith in democracy: millennials are the most disillusioned generation ‘in living memory’
- Voices of Gen Z: Youth Happiness Report
- Winston National Center on Technology Use, Brain, and Psychological Development (at the University of North Carolina at Chapel Hill) including:


 RSS Feed