Scientific Workforce, Ph.D. Career Pathways

May 2022 Update: Newer, Survey of Earned Doctorate (SED) data from 2020 was released in October of 2021 and available here. A future blog post will highlight 2020 & 2021 SED data after the 2021 SED data are released in October 2022.
The United States' National Science Foundation (NSF) collects a large amount of data on individuals receiving their doctorate degrees from U.S. universities.
These data include:
The SED focuses on recent Ph.D. graduates from a wide range of fields (lifes sciences, physical sciences, earth sciences, engineering, education, psychology, humanities) each year while the SDR captures employment information of individuals with Ph.D.s in science, engineering, or health fields, regardless of when they received their degree.
I referenced some of these data a year ago in my blog post:
Post-Ph.D. Career Plans: Consider the Possibilities
A new batch of SED data was released in December 2020 containing data reported in 2019.
So, while this data does not yet capture the effect of the COVID-19 pandemic on new Ph.D. graduates, we can still look at trends in employment, earnings, and more across a wide range of disciplines. New SDR data (from 2019) will be released in April 2021. So, stay tuned for a deeper dive into insights from that survey in a future post.
These data include:
- Survey of Earned Doctorates (SED)
- Survey of Doctorate Recipients (SDR)
- Science & Engineering Indicators, published by National Center for Science and Engineering Statistics
The SED focuses on recent Ph.D. graduates from a wide range of fields (lifes sciences, physical sciences, earth sciences, engineering, education, psychology, humanities) each year while the SDR captures employment information of individuals with Ph.D.s in science, engineering, or health fields, regardless of when they received their degree.
I referenced some of these data a year ago in my blog post:
Post-Ph.D. Career Plans: Consider the Possibilities
A new batch of SED data was released in December 2020 containing data reported in 2019.
So, while this data does not yet capture the effect of the COVID-19 pandemic on new Ph.D. graduates, we can still look at trends in employment, earnings, and more across a wide range of disciplines. New SDR data (from 2019) will be released in April 2021. So, stay tuned for a deeper dive into insights from that survey in a future post.
How US Ph.D. Employment Has Shifted from 1999 to 2019
The SED contains much historical data, allowing us to look at trends in Ph.D. production, employment, and more. The survey's Post-Graduation Commitments data is reported from 1999 to 2019 and we'll delve more into it below.
The SED contains much historical data, allowing us to look at trends in Ph.D. production, employment, and more. The survey's Post-Graduation Commitments data is reported from 1999 to 2019 and we'll delve more into it below.
Ph.D.s with Post-Graduation Commitments: Employment vs. Postdoctoral Training
The data plotted below reflects the breakdown of doctorate recipients with either employment or postdoctoral training commitments post-graduation.
Keep in mind, though, that many recent Ph.D. recipients do not report definite commitments post-graduation in the SED survey. In the data from 1999 to 2019, the average percentage of all Ph.D. recipients reporting definite post-graduation commitments is ~60%.
So, the data below reflects only that ~60% segment of Ph.D. recipients and should not be interpreted as fully representative of Ph.D. recipient employment levels as commitments could have solidified for recent Ph.D. recipients after the survey collection period or participants could have chosen not to disclose their post-graduation commitments in the survey.
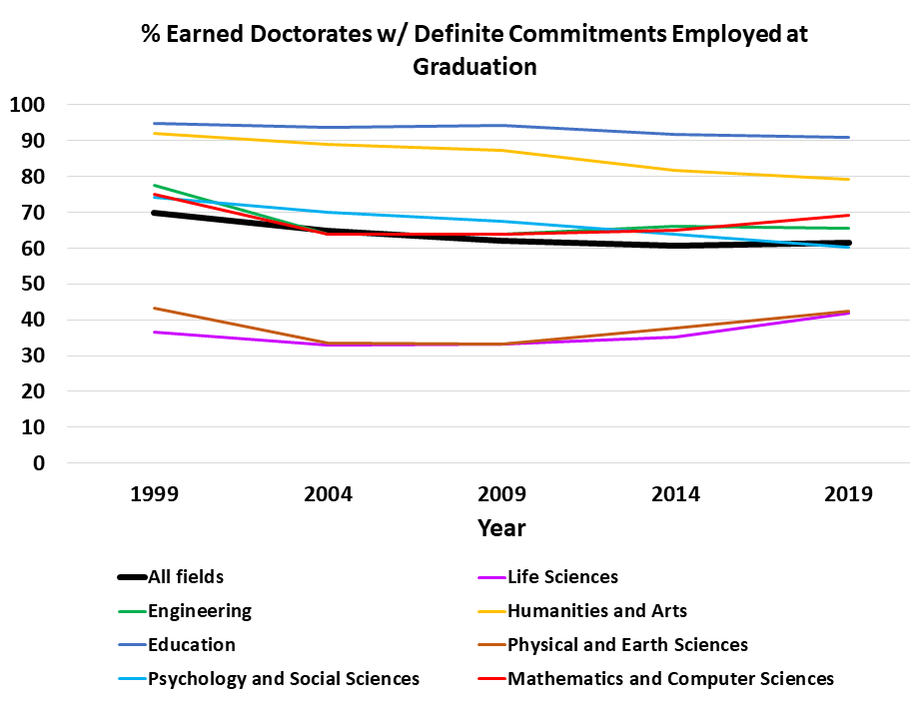
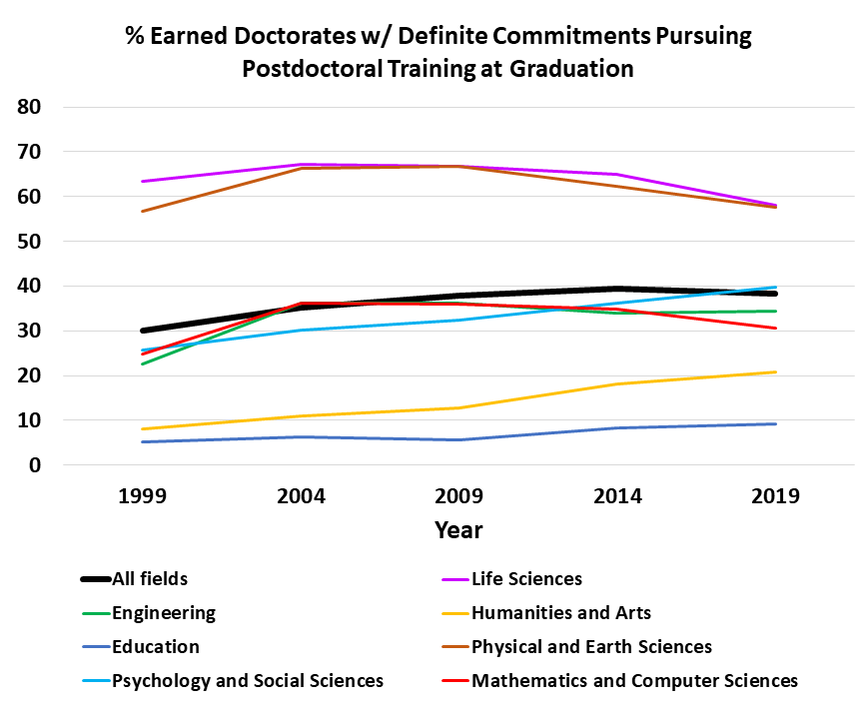
For the purposes of the data plotted above, postdoctoral training and employment are separate post-graduation commitments and the percentages in these two buckets plotted in the graphs above sum to 100% within each degree field. In these data, all post-graduation commitments are categorized as either employment or postdoctoral training.
These historical post-graduation commitments data tell us a few things:
1) Pursuing postdoctoral training is far more common in the Life Sciences and Physical (Chemistry, Physics) & Earth Sciences
2) Data collapsed across all fields show a trend toward a lower percentage of Ph.D. recipients securing employment post graduation, with particular declines in the Humanities & Arts and Psychology & Social Sciences
3) More Humanities & Arts and Psychology & Social Science Ph.D.s with post-graduation commitments are pursuing postdoctoral training, especially over the last 10 years
4) There are trends toward greater employment pursuit and lower engagement in postdoctoral training over the last 15 years in the Life Sciences and Physical & Earth Sciences (with a hint at a "peak postdoctoral training" level in the high 60% range in the year 2004)
Again, the data plotted above reflects only those Ph.D. recipients with definite post-graduation commitments. Let's examine the trends in the percentage of Ph.D. recipients reporting definite post-graduation commitments over the same 20-year time period, below.
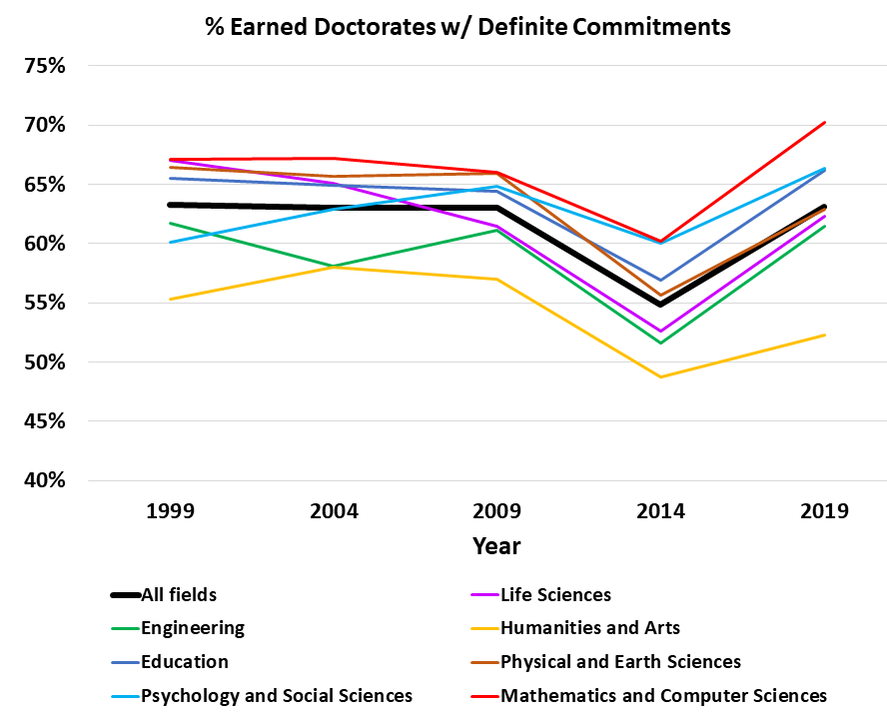
Takeaways from the graph above:
1) The "shock" of the financial crisis beginning in 2008 is evident slightly in the 2009 SED data and noticeably in the 2014 data of recent Ph.D. recipients with definite post-graduation commitments
2) While post-graduation commitment percentages recovered by 2019 in most fields, the Humanities & Arts were an exception with percentage of recent Ph.D. graduates with post-graduation commitments lower in 2019 than in 1999, 2004, or 2009
3) Mathematics & Computer Science Ph.D.s consistently experience the highest percentage of definite post-graduation commitments
It will be interesting to see what the SED show in relation to the COVID-19 pandemic's impact on post-graduation commitments in the coming years.
Are We Producing Too Many Ph.D.s?
A relevant point to consider in the post-graduation commitment data is how the number of Ph.D. degrees conferred and recipients with definite commitments has changed by field over the past 20 years. Essentially, are the fields with the largest percentage of definite commitments (Mathematics & Computer Science) producing more Ph.D.s to meet "demand" and, conversely, are fields with lower post-graduation commitment levels (Humanities & Arts) titrating their Ph.D. production as a result? While many in higher education may not be fond of a supply & demand analogy, ideally programs are scaling or reducing their enrollments based on employment demand for individuals with Ph.D.s in their respective fields.
A relevant point to consider in the post-graduation commitment data is how the number of Ph.D. degrees conferred and recipients with definite commitments has changed by field over the past 20 years. Essentially, are the fields with the largest percentage of definite commitments (Mathematics & Computer Science) producing more Ph.D.s to meet "demand" and, conversely, are fields with lower post-graduation commitment levels (Humanities & Arts) titrating their Ph.D. production as a result? While many in higher education may not be fond of a supply & demand analogy, ideally programs are scaling or reducing their enrollments based on employment demand for individuals with Ph.D.s in their respective fields.
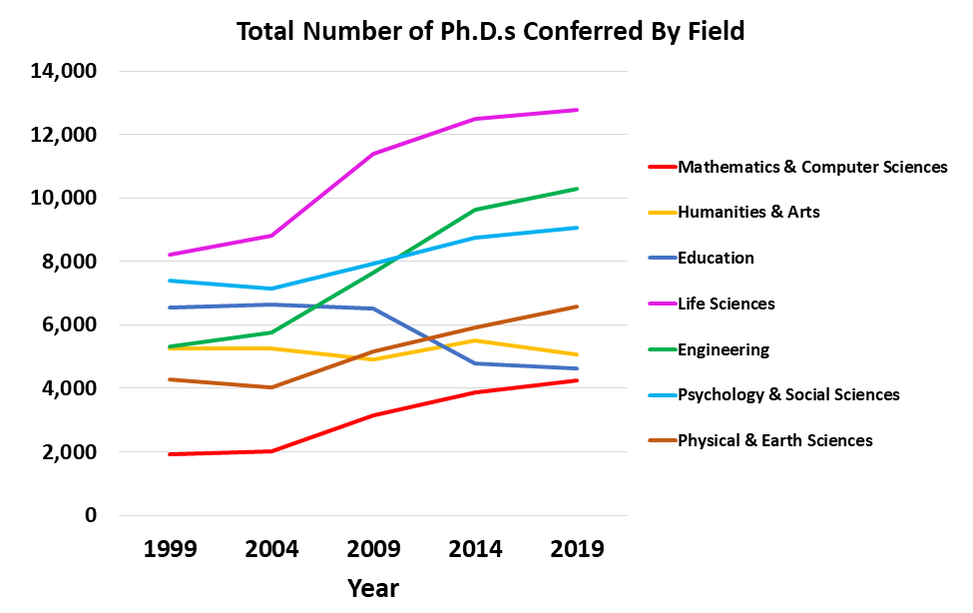
Overall, there has been a 35.5% increase in the number of total US doctorates awarded from 1999 (41,100 Ph.D.s) to 2019 (55,703 Ph.D.s). Education doctorates (Ed.D.s; Ph.D.s) awarded decreased by 29.3% from 1999 to 2019 while the decline was 4.2% for the Humanities & Arts. The growth in Ph.D.s awarded in other fields over this twenty year time period was staggering: a doubling of degrees (118.7% increase) awarded in Mathematics & Computer Sciences and near doubling (93.3% increase) for Engineering Ph.D.s awarded. While less dramatic, the growth of Ph.D.s awarded in the Life Sciences (55.8%), Physical & Earth Sciences (53.7%), and Psychology & Social Sciences (22.8%) was still quite robust from 1999 to 2019.
Take-home point from the Ph.D.s conferred data:
There are a lot of Ph.D.s being produced each year and while some fields may be producing recipients with good job prospects (Mathematics & Computer Sciences, 70.2% with post-graduation commitments in 2019) others continue to produce very high levels of Ph.D.s with moderate job prospects based on the SED data (Life Sciences, 62.3% with post-graduation commitments in 2019). The Humanities & Arts field showed a plateauing to slight decrease in Ph.D.s awarded over the past 20 years, suggesting this field is responding to lower "demand" for Ph.D.s (52.3% with post-graduation commitments in 2019), though some may argue not rapidly enough.
What Sectors Employed Recent Ph.D. Recipients in 2019?
The SED data reports the US employment sector of doctorate recipients with definite post-graduation commitments. These sectors are broad and include government, industry or business, nonprofit organizations, academe (not postdoc roles), or other/unknown sector. Postdoctoral training and commitments outside the United States are not reflected in these employment numbers.
The SED data reports the US employment sector of doctorate recipients with definite post-graduation commitments. These sectors are broad and include government, industry or business, nonprofit organizations, academe (not postdoc roles), or other/unknown sector. Postdoctoral training and commitments outside the United States are not reflected in these employment numbers.
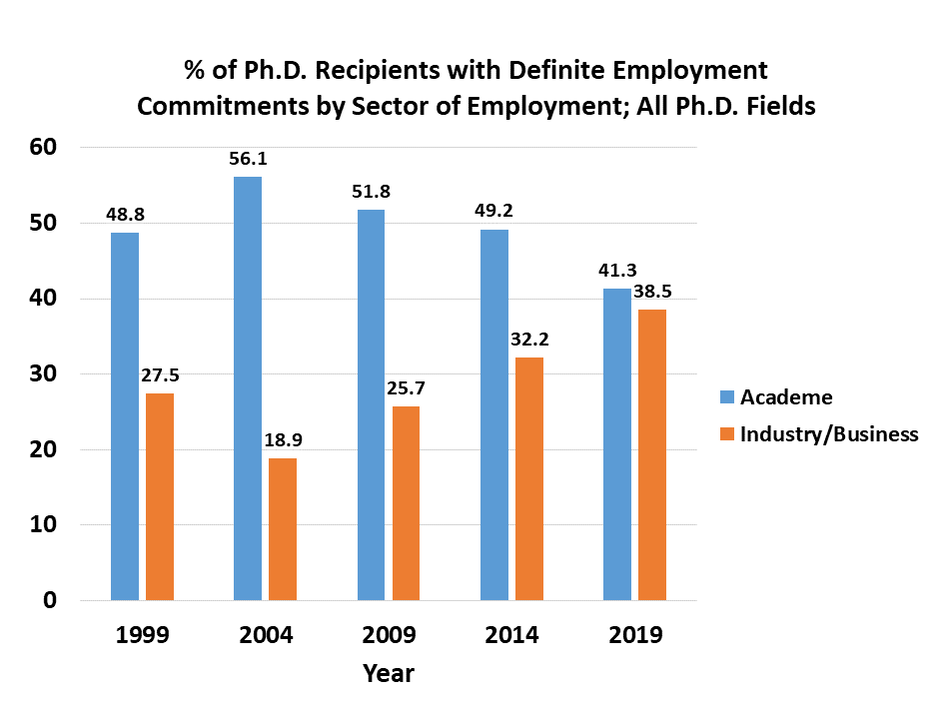
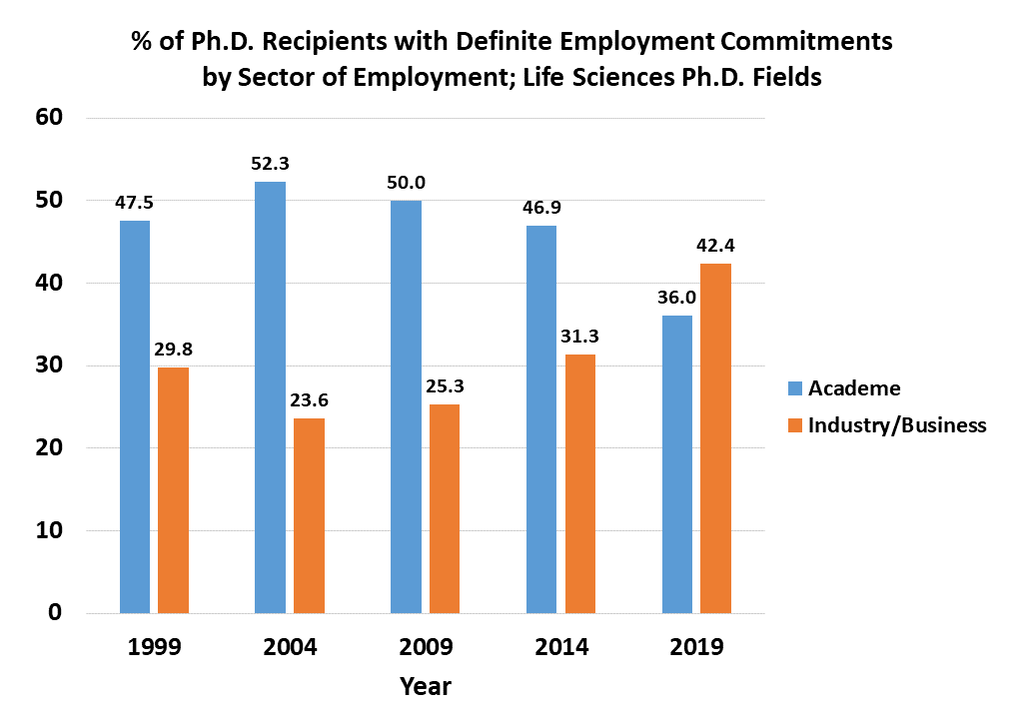
The sector employment data make clear employment in academe has declined over the past 20 years across all doctorate recipients, though more so in some fields of study. Across all doctorate recipients, there has been a 15.4% decline in the proportion of individuals employed in academe from 1999 to 2019 while the proportion employed by industry or business grew by 40% over the same time period.
The Ph.D. degree areas with the largest decline in the proportion of recipients working in academe from 1999 (48.1%) to 2019 (27.5%) was Mathematics & Computer Sciences at 42.8%, followed by a decline of 24.2% in the Life Sciences - from 47.5% of recipients in 1999 to 36% in 2019. In fact, as the graph above shows, the 2019 SED data indicates a larger proportion of Life Sciences Ph.D. recipients employed in industry or business than academe, a first since the data have been collected. Again, a reminder that postdoctoral training is NOT INCLUDED in these data. Rather, the graphs above display the breakdown of 2019 Ph.D. recipients with employment post-graduation commitments by sector.
Interestingly, employment in academe remained relatively stable in the fields of Psychology & Social Sciences (51.9% in 1999 and 51.7% in 2019), declined more modestly in Humanities & Arts (10.4% decline from 80.7% of 1999 Ph.D. recipients to 72.3% in 2019), and actually increased for the field of Education (20.3% increase from 47.2% of 1999 Ph.D./Ed.D. recipients to 56.8% in 2019).
Regardless, the data make clear that employment trends for recent Ph.D. recipients, especially in the Science, Technology, Engineering, & Math (STEM) fields, have changed markedly over the past 20 years.
These data bring to light a question that continues to be asked more and more in graduate education: Are we preparing Ph.D. students for a 21st Century career landscape or one of the past? Clearly, employment prospects in academe are shrinking.
Sectors Employing Ph.D.s in 2019 by Degree Field
It should be noted that there are vast differences in which sectors employ Ph.D. recipients based on their field of study, as indicated in the pie charts below.
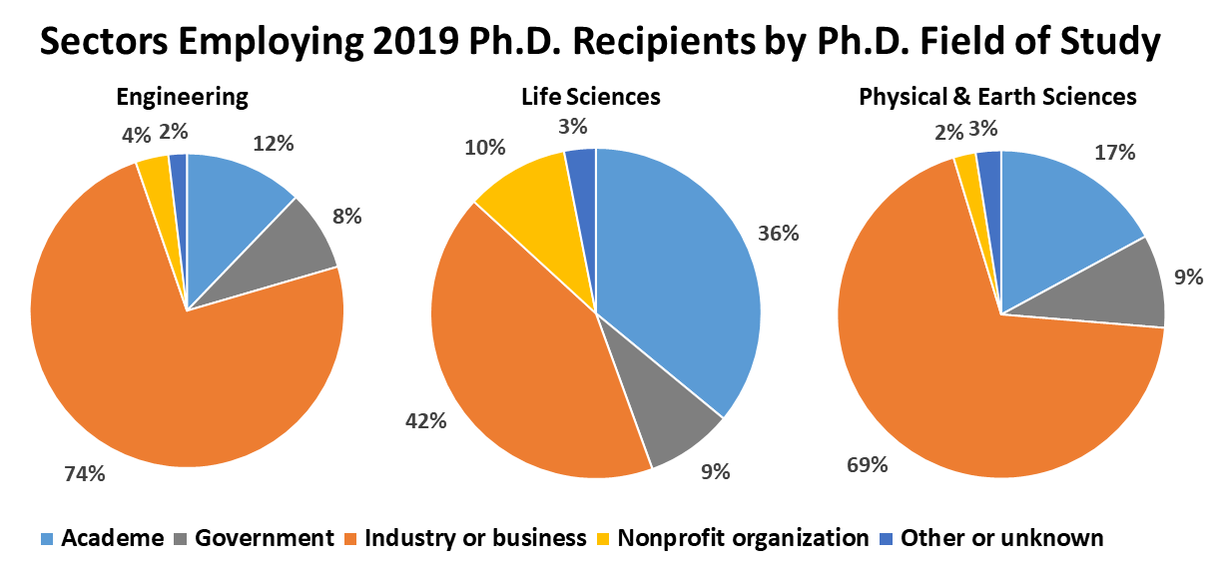
While not plotted above the breakdown for employment sectors for 2019 Mathematics & Computer Sciences Ph.D.s was: 64% Industry/Business, 28% Academe, 5% Government, 2% Nonprofit, & ~2% Other or Unknown.
Clearly, being employed by industry or business sectors was the most common career path for recent Ph.D.s in STEM in 2019.
Conversely, academe is by far the largest sector employing recent Ph.D.s in Humanities & Arts, Psychology & Social Sciences, & Education.
Clearly, being employed by industry or business sectors was the most common career path for recent Ph.D.s in STEM in 2019.
Conversely, academe is by far the largest sector employing recent Ph.D.s in Humanities & Arts, Psychology & Social Sciences, & Education.
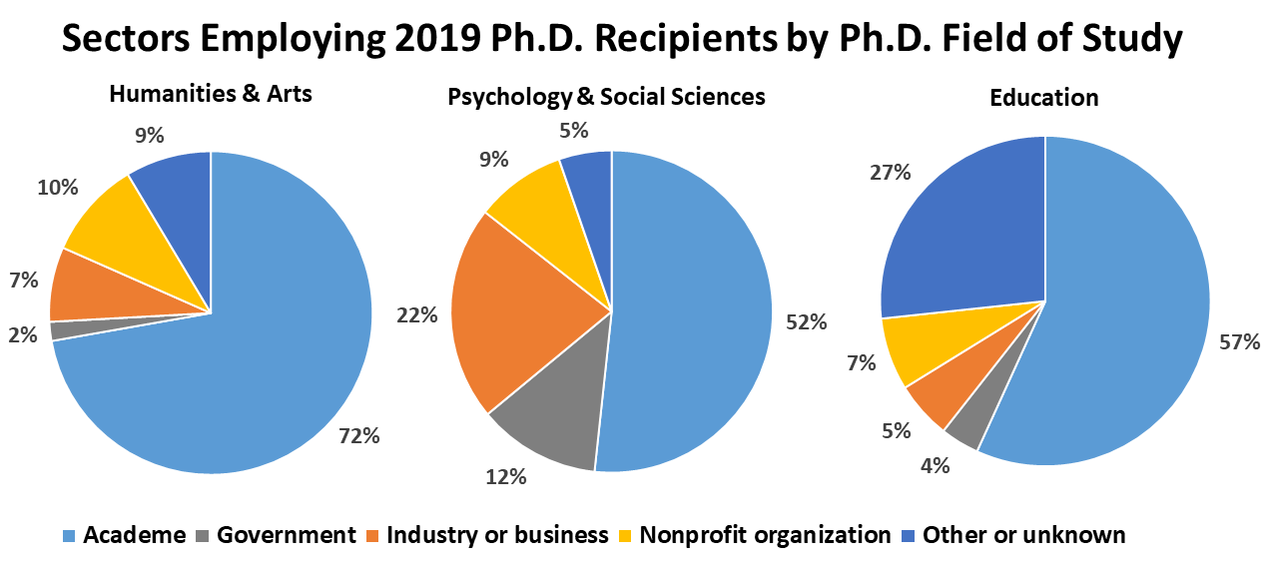
Clearly, in 2019, the sectors employing Ph.D.s varied WIDELY based on Ph.D. field. These facts raise the question, are we adequately preparing all Ph.D.s for their next career step given the diversity of paths they pursue?
Post-Ph.D. Plans: Pursue a Postdoc or Not?
While I have discussed my personal perspectives on the value of doing a postdoc, including using it for career exploration and self reflection, this is often a crucial decision point for many recent Ph.D. recipients. There are clearly financial considerations as postdoctoral salaries or stipends are relatively low compared to many Ph.D. holders' earning potential (discussed in more detail, below). However, the freedom and autonomy one can have in a postdoctoral position may not be matched for the rest of one's career and it can provide a nice period of scholarly and self exploration before making your next career move in academe, industry, or beyond.
Postdoctoral training has also become necessary in many fields to be competitive for faculty positions as this additional training allows time for Ph.D. holders to build a larger collection of scholarly work, begin to demonstrate research independence, and develop crucial skills in lab management and grant writing, among other tasks required of faculty at research-intensive institutions. Teaching postdocs have also become more common for recent Ph.D.s seeking to build pedagogical and classroom management skills as they pursue teaching-focused faculty positions.
As mentioned above in the breakdown of post-graduation commitments of recent Ph.D. recipients over the past 20 years, postdoctoral training is the majority commitment path for many fields: 59% of Life Science Ph.D. recipients in 2019 with post-graduation commitments pursued postdoctoral training while that percentage was ~56% in the Physical & Earth Sciences. The postdoctoral path is less common in other Ph.D. fields, though.
The sheer numbers of 2019 Ph.D. recipients (collapsed across fields) pursing postdoctoral training (12,091), though, still dwarfs employment numbers in any other single employment sector (8,019 employed in academe; 7,476 employed in industry; 3,929 employment in other sectors).
For many a postdoc is the default "next step" in their academic training and while it may fulfill this role for some, we should be empowering Ph.D. students with the information and space to decide if a postdoc makes sense for them (whether it fits into a career plan).
Median Salaries of US Doctorate Recipients in 2019
While others have published about the financial impact of pursuing postdoctoral training versus employment post-Ph.D., the 2019 SED data allow us to look at how salaries differ between those pursuing postdoctoral training or employment by field of study (and by sex, though not discussed in this post).
The percentage of median postdoctoral salaries to other employment salaries for new doctorate recipients demonstrate that the salary discount for pursuing postdoctoral training various greatly by field. In the Life Sciences, median postdoctoral salary ($50,000) is 61% of the median of other employment salary ($82,000). The percentage is as low as 49% in Engineering and as high as 94% in Humanities and Arts.
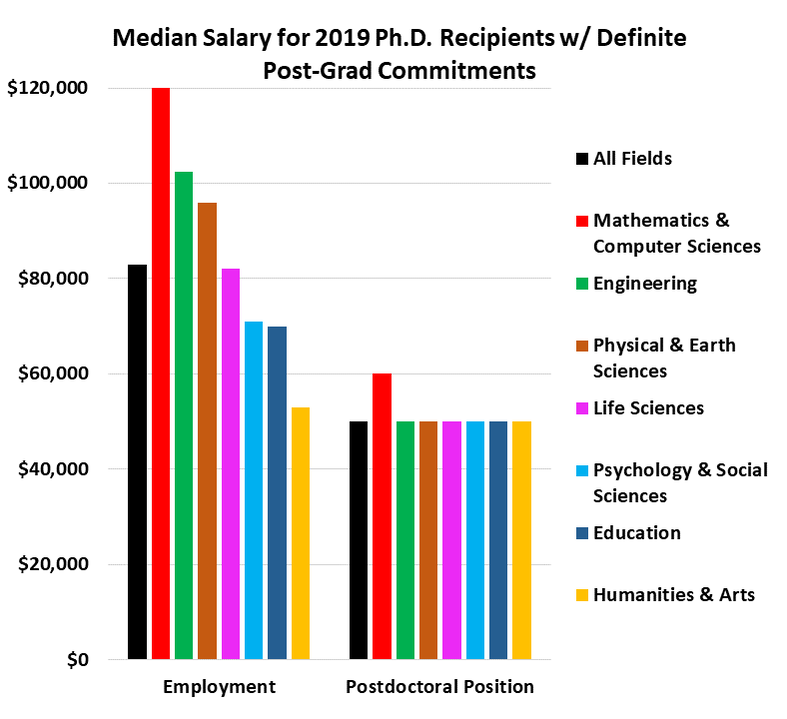
The median salary for recently employed doctorates also varies greatly by field. $53,000 was the median salary for Humanities and Arts doctorate recipients in 2019 while it was $68,000 in Psychology, $70,000 in Education, $85,000 in Biological and Biomedical Sciences, $95,000 in Chemistry, $102,500 in Engineering, and $120,000 in Mathematics and Computer Sciences.
While these data are aggregated over many sub-fields and employment sectors and represent the median of a wide salary range, they hopefully allow Ph.D. holders to have a sense of the salaries they can obtain post-degree.
An interesting question these data cannot answer by themselves is whether there are more Ph.D.s interested in employment in certain sectors than there are positions, which affect their ability to secure employment. It is possible (and probable) that many individuals pursue a postdoc after their Ph.D. because they cannot secure other employment upon graduation.
More Data to Explore
There is a wealth of data in the SED and beyond. This post has just scratched the surface.
Next month I hope to touch on some of the SED data comparing temporary visa holders and US citizens and permanent residents. In addition, 2019 SDR data should be published by NSF in April, which will allow for a deeper dive into employment trends for Ph.D.-holders in the US.
If you are interested in exploring the data that made up this post, please visit the link below.
You can also check out all the SED data on NSF's website.
Conclusions
While the NSF SED data prompt several questions about the doctorate workforce and career pathways that remain to be interrogated, what is clear is that post-Ph.D. career pathways for doctorates issued in the United States are changing across a wide range of disciplines. Through data such as this, those of us interested in improving graduate student and postdoc career and professional development can hopefully share post-Ph.D. employment insights with a variety of stakeholders (students, postdocs, faculty, university administrators, & lawmakers) to influence the environment at our universities.
We must be more intentional in considering what we are training Ph.D. students and postdocs for and how their employment prospects have changed. By doing so, we can hopefully build a responsive graduate-level training ecosystem at our universities that takes into account the future economic stability and prosperity of our Ph.D. students and postdocs.


 RSS Feed