Scientific Workforce, Ph.D. Career Pathways
The United State's National Science Foundation (NSF) collects a wealth of data on individuals who received their doctorate degrees from US universities. Back in April, they released their most recent batch of data from their 2019 Survey of Doctorate Recipients (SDR). The SDR provides demographic, education, and career history information from all individuals with a research doctoral degree in a science, engineering, or health (SEH) field from a university in the United States. As the SDR seeks to capture the full scope of US SEH Ph.D. employment, it surveys anyone with a Ph.D. in SEH fields from a US university regardless of year of graduation: some SDR respondents received their Ph.D.s a few years ago and some 20+ years ago. This is different from the Survey of Earned Doctorates (SED) which surveys new US Ph.D. recipients and whose data I shared in an earlier blog post. Here, I will delve into some of the trends observed in the 2019 SDR data to give those with a Ph.D. in a SEH field more insights into employment possibilities after they receive their degree.
Important Disclaimer
SDR data is from a survey of US doctorate recipients and therefore does not reflect the full scope of Ph.D.s employed in the United States. In addition, as it only surveys those who received their Ph.D. in the United States, it does not capture individuals who obtained their doctorates outside the country and then came to the US for additional training (ie, postdocs) and employment. Finally, as with all surveys, there is certainly some selection bias regarding who completes the SDR. Discussions and insights here are based on SDR data and will be limited in their generalizability based on inherent limitations in the SDR.
For more on the SDR methodology, see the Survey Overview details on their website.
Where are SEH Ph.D.s Employed
Across all doctorate recipients surveyed in the 2019 SDR, the US states with the largest proportion of science, engineering, or health Ph.D.s employed in them included the District of Columbia (technically not a state but represented in the state-level data; ~2.5% of the population are SEH Ph.D.s), Massachusetts (0.8%), and Maryland (0.6%). The median percent of any state's population consisting of employed SEH Ph.D.s was 0.2%. While DC, Massachusetts, and Maryland remained the top states employing biological, agricultural, and environmental life science Ph.D.s, others with high proportions of bio science Ph.D. employment included Vermont, Montana, Connecticut, North Carolina, Nebraska, California, & Washington state. Note that as these are calculated as proportion of a state's 2019 population, states with relatively low population counts (Vermont, Montana, & Nebraska) have many less Ph.D. scientists employed in them than larger states. For example, according to the 2019 SDR, there are 32,900 biological, agricultural, and environmental life science Ph.D.s employed in California (with a population of 39.5 million in 2019) while Vermont has 600 (among a population of ~600,000).
Top 10 states for employing computer science Ph.D.s: DC, Washington, Massachusetts, California, Maryland, New York, Utah, Virginia, Oregon, New Jersey
Top 10 states for employing physical science Ph.D.s: DC, Delaware, Massachusetts, Maryland, New Mexico, Colorado, Oregon, Connecticut, California, New Jersey
And many of these states are also top employers of engineering Ph.D.s.
Given these data you may have more luck pursuing Ph.D.-level employment in certain areas of the country over others.

How many Ph.D.s are working as postdocs?
Across all SEH Ph.D.s surveyed in 2019, ~3.3% of those employed worked as a postdoc. However, the percent of employment represented by postdocs varied by field of doctorate with ~6.1% of biological, agricultural, and environmental life science Ph.D.s employed as postdocs while ~1% of computer science Ph.D.s were employed as postdocs. The percentage of engineering Ph.D.s employed as postdocs was ~2%.
Given a postdoctoral position is by definition temporary, one would expect the percent of all employed SEH Ph.D.s in a postdoc would be rather low. While the general proportion of Ph.D.s employed in postdocs is relatively low, some of the trends in postdoctoral employment are concerning.
Unfortunately, many postdocs have been in their positions longer than the 5 year post-Ph.D. guidance outlined by The National Academies of Sciences, Engineering, and Medicine's The Postdoctoral Experience Revisited report released in 2014 (see press release). According to the 2019 SDR data, 19% of all science postdocs were >5 years from the date of their Ph.D. being awarded and this percentage was slightly higher (21.3%) for biological, agricultural, and environmental life sciences postdocs. So, as many as 1 in 5 postdocs employed in the US are 5+ years past receiving their terminal degree.
In addition, over the past 10 years a larger proportion of the US postdoctoral population is being filled by those 5+ years post-Ph.D. In the 2010 SDR data, only 13.1% of all science postdocs and 14.9% of bio, ag, and environ life science postdocs were >5 years from their Ph.D. being awarded. And while the 2019 data is off the peak of >25% of postdocs >5 years from their Ph.D. seen in 2015, the proportion of Ph.D.s employed as postdocs >5 years from their terminal degree is still ~45% higher in 2019 than 2010.
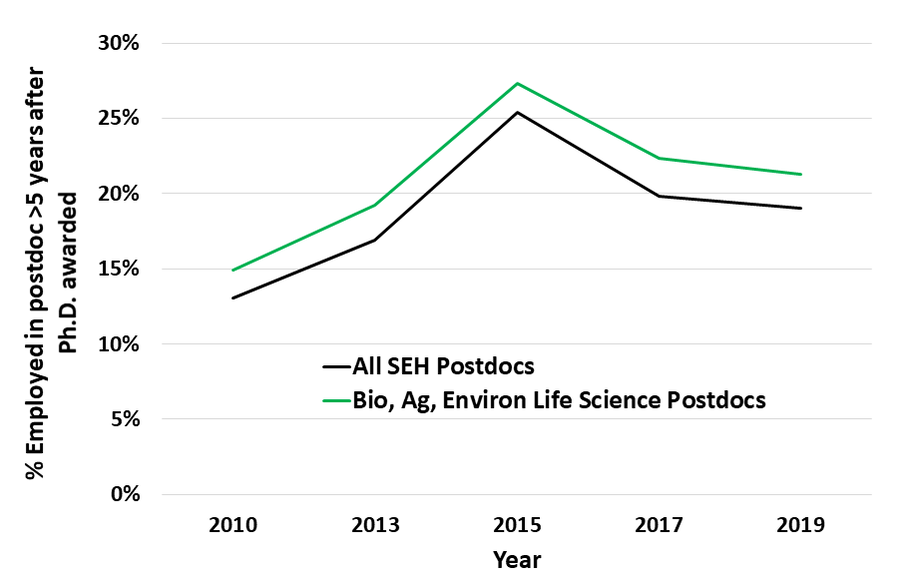
Percentage of all postdocs employed each year of SDR collection who received their Ph.D.s more than 5 years ago. Note the rapid growth in the percent of postdocs >5 years from their terminal degree from 2010 to 2015 and that 2019 data is still ~45% above 2010 levels. SEH= Science, Engineering, & Health
So, while improvements have been made around limiting long postdoctoral training periods, more needs to be done to assist these individuals in transitioning into more permanent positions either within or outside academia.

How many SEH Ph.D.s work for colleges or universities
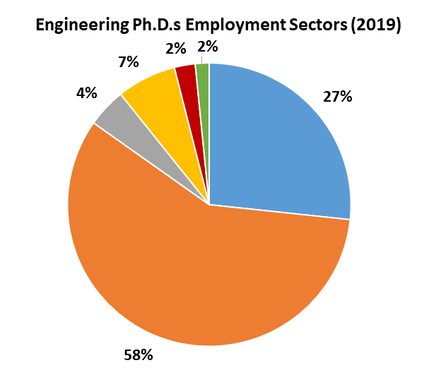
Across all science ("all science" refers to all SEH fields surveyed except engineering and health) Ph.D.s surveyed in the 2019 SDR, ~48% work for and educational institution while ~30% are employed by a for-profit company and ~8% work for either the federal or state government. The distribution of sectors employing Ph.D.s in 2019 differed markedly by the field of the individual's doctorate degree with employment by educational institutions quite high for the social sciences (~67% of employed Ph.D.s) and for-profit companies being the largest sectors employing computer & information science (~54%) and engineering Ph.D.s (~58%).
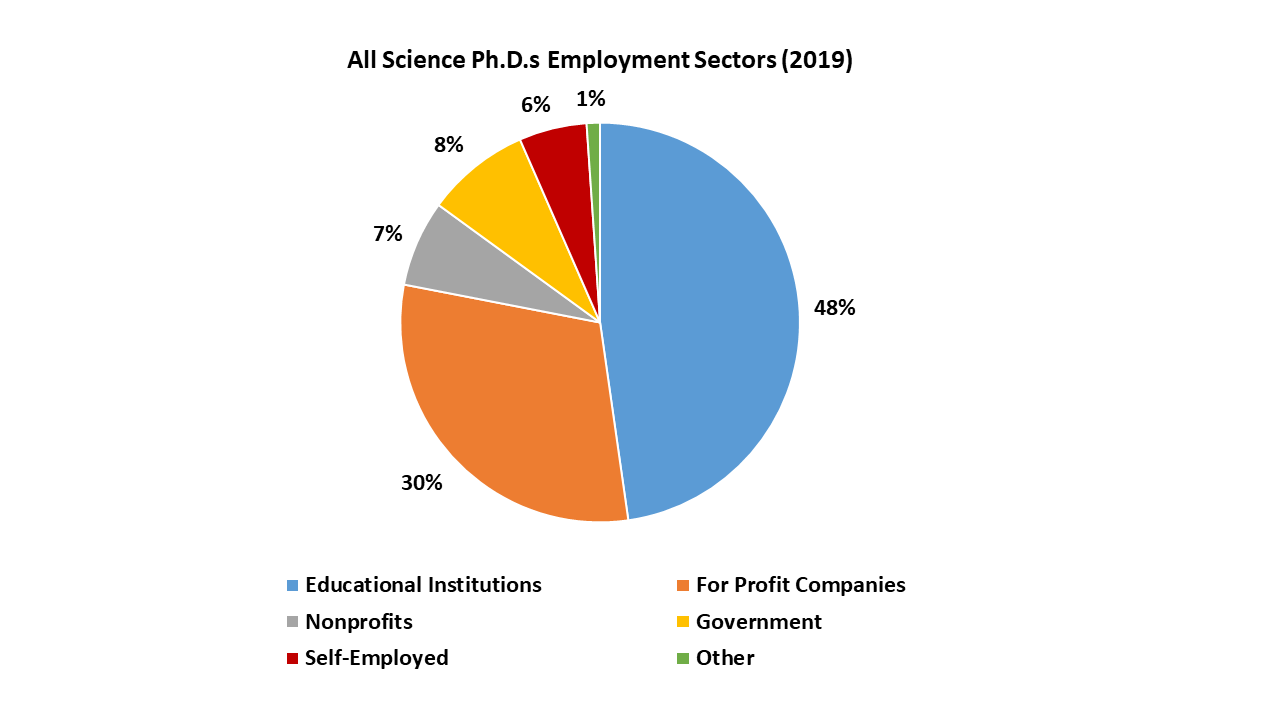
Nearly half of all science Ph.D.s surveyed in the 2019 SDR were employed by educational institutions. The distribution of employment sector by Ph.D. degree field varied markedly, however (see below).
 |  |

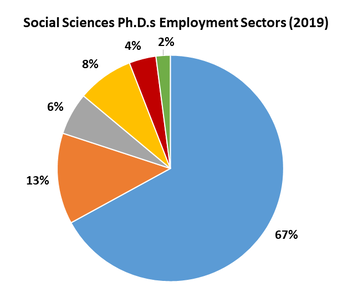 | 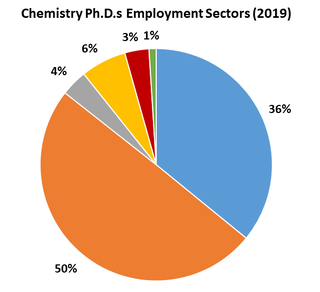 |
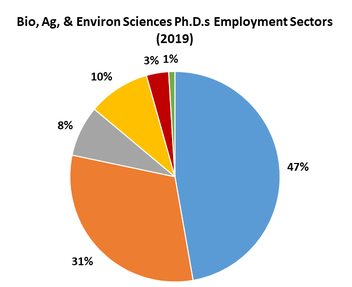
While educational institutions are the top employers of social science Ph.D.s, they employ ~47% of those with Ph.D.s in the biological, agricultural, and environmental sciences. The proportion of engineering and chemistry Ph.D.s employed by educational institutions is even less with for-profit companies employing 50%+ of Ph.D.s from these fields.
These data suggest certain sectors of employment may be more available to particular Ph.D. fields than others. It is difficult, however, to disentangle whether engineering and chemistry Ph.D. skills, for example, are more valued by for-profit companies than those in the social sciences or whether there is a greater openness to pursuing non-academic careers in these areas. It is possible there are things to learn from specific departments and programs who place Ph.D.s into diverse career areas that could be modeled by others. Certainly, providing diverse career pathways for Ph.D.s is critical as the "traditional" path of obtaining faculty positions becomes less available in many fields.
These data suggest certain sectors of employment may be more available to particular Ph.D. fields than others. It is difficult, however, to disentangle whether engineering and chemistry Ph.D. skills, for example, are more valued by for-profit companies than those in the social sciences or whether there is a greater openness to pursuing non-academic careers in these areas. It is possible there are things to learn from specific departments and programs who place Ph.D.s into diverse career areas that could be modeled by others. Certainly, providing diverse career pathways for Ph.D.s is critical as the "traditional" path of obtaining faculty positions becomes less available in many fields.
Ph.Ds. Employed at Educational Institutions Who are Tenured Faculty or on Tenure-Trac
Among the ~108,000 respondents to the NSF SDR 2019 survey who reported being employed at educational institutions in the US, 44.5% were tenured or on the tenure track <10 years since receiving their doctorate degree. This percentage jumped to 69.1% in those 10+ years from degree award. However, there were noticeable differences by degree field in the percentage of Ph.D.s employed at educational institutions who were tenured faculty or on the tenure-track <10 years from their Ph.D. with ~25% in this category among the biological, agricultural, and environmental life sciences to 60%+ for computer and information sciences and social sciences Ph.D.s.
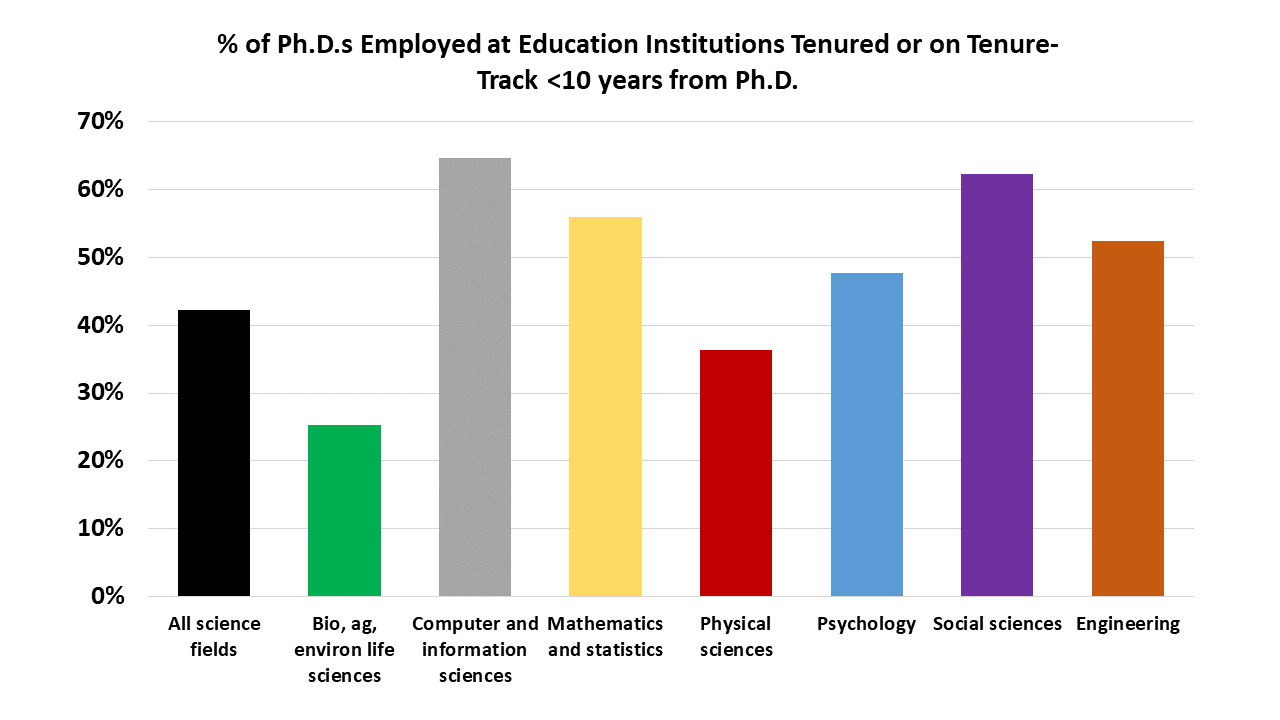
Percentage of early career Ph.D.s employed at US educational institutions in tenured or tenure-track faculty roles varies by Ph.D. field with relatively low percentages in the life sciences and high percentages in computer & information sciences.
One might speculate that looking at these data for those <10 years from their Ph.D. points to a potential bottleneck to obtaining faculty positions among certain fields. Also, the length of postdoctoral positions and/or use of more contingent positions (lecturer, research associate) in educational institutions could be higher in some fields than others. The SDR data can offer some insights as the proportion of postdocs who are 5+ years from obtaining their Ph.D. is higher in the life sciences fields which also had the lowest proportion of Ph.D.s employed at educational institutions in tenured or tenure-track faculty positions (plotted in green in the graph below and above, respectively).
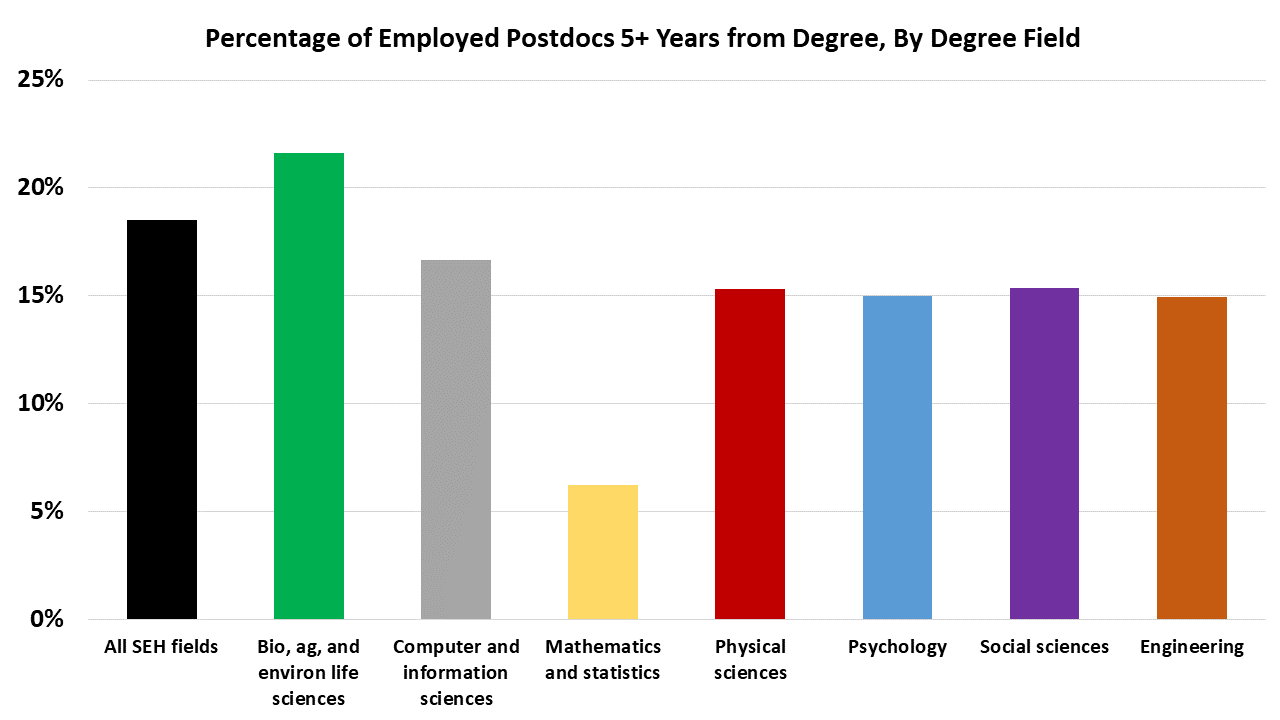
Percentage of Ph.D.s employed as postdocs who are 5+ years from receiving their Ph.D. degrees, by Ph.D. field of study. SEH = Science, Engineering, & Health
While certainly the life sciences have the highest percentage of Ph.D.s employed as postdocs 5+ years from their Ph.D. and the lowest percentage of those <10 years from Ph.D. in tenure-track or tenured faculty roles, there is not perfect correspondence between lengthy postdocs and percentage of early-career Ph.D.s employed as tenured or tenure-track faculty. This could be for a myriad of reasons as the SDR data is not perfect. Remember, it only surveys individuals who earned their Ph.D.s in the United States. Thus, fields where a high percentage of workers obtain their Ph.D. outside the US are going to have less respondent representation in this survey.
For instance, we know that many postdoctoral scholars in the United States are international, who either obtained their Ph.D. in the US and continued in postdoctoral training via various visa types or who received their Ph.D. outside the US before doing a postdoc in the US. The 2019 SDR shows that ~54% of US Ph.D.s employed as postdocs are US citizens and other data from NSF shows ~49% of postdocs in the US were born oversees. In some fields including computer science and engineering, NSF estimates 55-60% of Ph.D.s working in those areas in the United States are foreign-born. Thus, the various employment trends shared so far can be affected by various limitations to employment for those individuals requiring visa sponsorship by their employer, the frequency of which may differ by Ph.D. field and the proportion of international students and scholars working in that area in the United States. I discussed some of the challenges around being an international scholar in the US (including visa restrictions) in an earlier series of blog posts.
Regardless of how international scholar dynamics may affect these data, it is clear from the 2019 SDR data that there are vast differences in the proportion of "early career" Ph.D.s in tenure-track or tenured faculty positions based on their degree field.
Decline in "Early Career" Ph.D.s Working in Tenure-Track & Tenured Faculty Role
Much has been made of the decline in faculty positions available to Ph.D.s over recent years. The SDR data allows us to partially look at this trend by asking how the percentage of Ph.D. recipients employed at 4-year educational institutions has changed over the years. Here, I decided to look at the SDR data from 2010 and compare it to 2019.
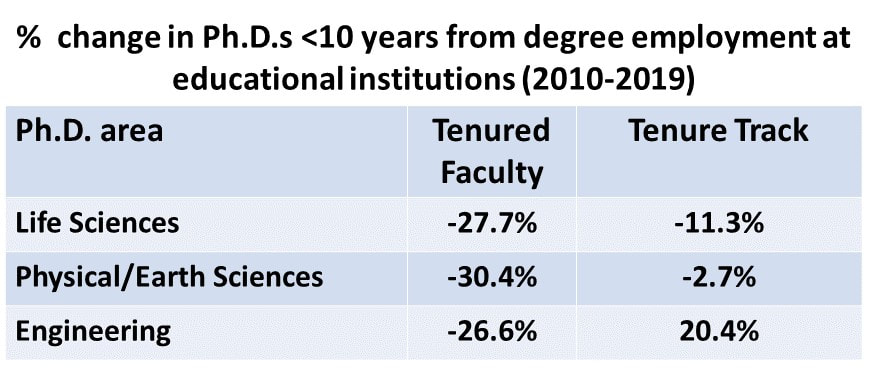
Over the past 9 years the percentage of tenured faculty who are less than 10 years from the Ph.D. in most science fields has declined by 25-30%. The decline is less steep for tenure-track faculty in the life and physical/earth sciences. Furthermore, the proportion of engineering Ph.D.s <10 years from degree employed at educational institutions in tenure-track positions has actually increased from 2010 to 2019 based on the SDR data. Even in the engineering group, though, securing tenure by 10 years post degree has become less common, presumably as the need and/or length of postdoctoral positions have increased.
The 2021 SDR data collection is currently underway and I will be very curious to see how these data look post-COVID. Will the percentages of early career Ph.D.s able to enter the faculty ranks fall even further? Only time will tell.
The 2021 SDR data collection is currently underway and I will be very curious to see how these data look post-COVID. Will the percentages of early career Ph.D.s able to enter the faculty ranks fall even further? Only time will tell.

Median Salary Data for Science & Engineering Ph.D.s
As mentioned earlier, the prevalence of Ph.D. labor in the US who are supported on temporary visas is quite high. Many international students come to the US for their graduate training and seek employment in the country after finishing their degrees. The SDR data reports out median salaries for Ph.D. holders by citizenship status, which is plotted below by doctoral degree field.
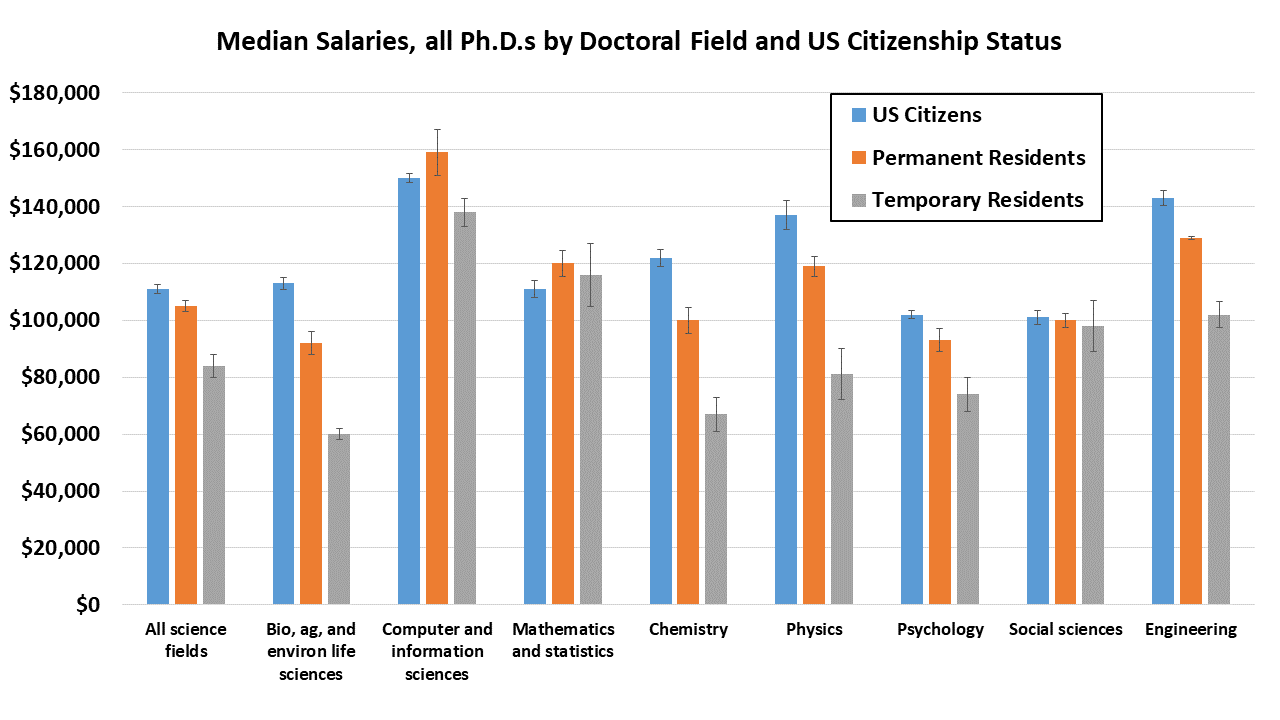
The 2019 SDR data show that, in general, temporary residents with Ph.D.s make less than US citizens and permanent residents but not in all fields.
It is clear from these data that median salaries are lower, in aggregate, for temporary visa (J1, H1-B) holders in virtually all Ph.D. fields except mathematics & statistics AND social sciences. US permanent residents' median salaries also tend to be lower but not in all fields. In fact, in computer & information sciences and mathematics & statistics permanent residents earn slightly more than US citizens.
It is difficult to speculate too much on these data but one potential reason for lower median salaries for temporary visa holders in particular could be the result of many of these individuals working at US universities where the visiting scholar (J1) visa category is commonly used when an individual is working as a postdoctoral scholar or some other contingent, non-tenure track position (research associate). When a temporary visa holder is employed by a company, however, they require H-1B sponsorship which is subject to a "prevailing wage" which should prevent these individuals' salaries being below "market" rate, at least in theory. The largest sponsors of H-1Bs in the US are typically companies working in the computer & information sciences or data analytics where Ph.D.s in the areas of computer science, math, and statistics would be in high demand. So, the increased salaries for temporary visa holders in those fields could be driven by who is employing the doctorate recipients (technology companies paying high wages).
It is difficult to speculate too much on these data but one potential reason for lower median salaries for temporary visa holders in particular could be the result of many of these individuals working at US universities where the visiting scholar (J1) visa category is commonly used when an individual is working as a postdoctoral scholar or some other contingent, non-tenure track position (research associate). When a temporary visa holder is employed by a company, however, they require H-1B sponsorship which is subject to a "prevailing wage" which should prevent these individuals' salaries being below "market" rate, at least in theory. The largest sponsors of H-1Bs in the US are typically companies working in the computer & information sciences or data analytics where Ph.D.s in the areas of computer science, math, and statistics would be in high demand. So, the increased salaries for temporary visa holders in those fields could be driven by who is employing the doctorate recipients (technology companies paying high wages).
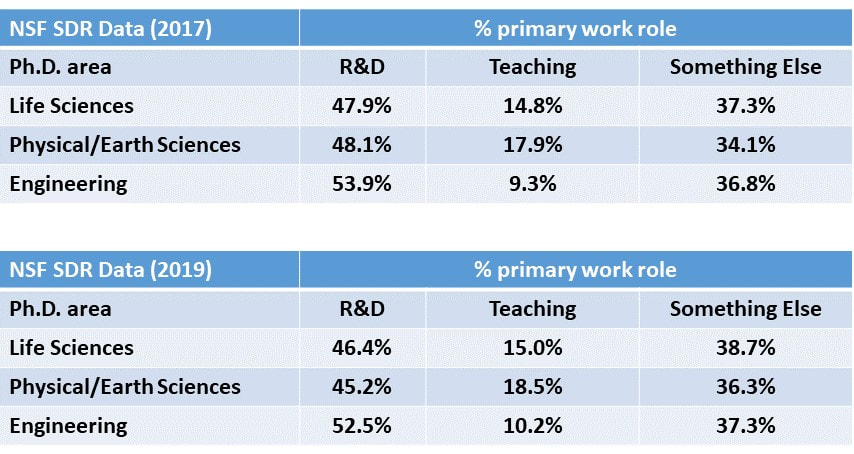
Beyond who employs Ph.D.s what work they do can drastically affect their level of compensation. As seen in the graph below, Ph.D. recipients whose primary work activity is teaching have lower median salaries than those in research & development (R&D) roles or focused more on professional services, administration, management, or sales. Clearly these data are also colored by who is employing Ph.D.s as teaching roles are almost entirely within universities whereas R&D roles could be at companies, universities, government agencies, or other employers.
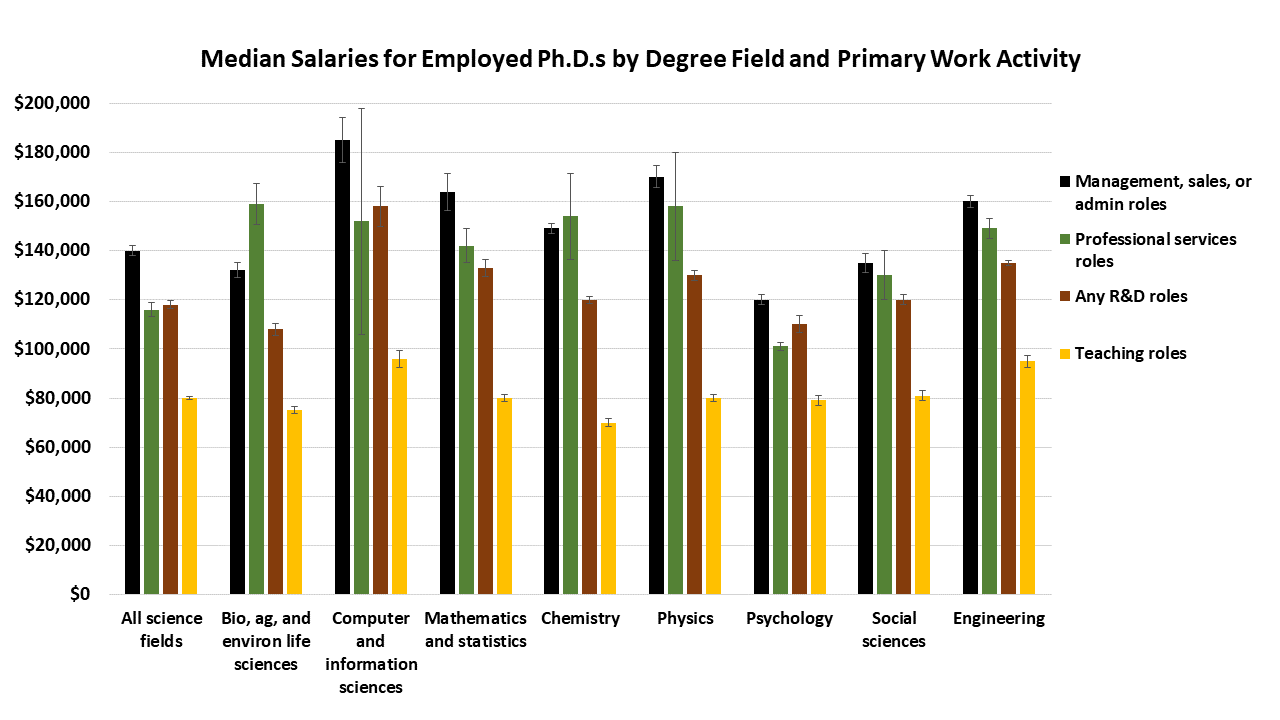
Median salaries for Ph.D.s are lower for those whose primary work activity is teaching, regardless of Ph.D. field.
Note, however, that SDR data show the percentage of Ph.D.s whose primary work activity is teaching is ~10-15% of science and engineering Ph.D. recipients (see table, below). And there has been relatively little change in the percentages of Ph.D. recipients reporting their primary work role as teaching over the past few years. The general distribution of primary work roles for science and engineering Ph.D.s from 2017 to 2019 has remained relatively stable. And, as has been discussed in a previous post, the fact that greater than a third of science and engineering Ph.D.s report their primary work role as falling in areas outside research and development or teaching emphasizes the fact that there are many positions in administration, communications, management, and more that fall outside of the main boxes of teaching and research available to Ph.D. holders. I will be interested to see whether these distributions of work roles shift post-pandemic in the 2021 SDR data. Will there be less teaching roles? More R&D, especially in the life sciences? Or will the "something else" category continue to grow as Ph.D.s pursue more diverse career pathways?
Salary Growth for Science & Engineering Ph.D.s with Additional Years of Experience
The previous two salary graphs plot median salaries for all US Ph.D. recipients who completed the 2019 SDR. So, there are individuals in those data who are 20+ years from receiving their Ph.D.s and those who graduated only a few years ago. NSF also reports data by Ph.D. field filtered by years since doctorate which shows that the median salaries 5 years or less from being the Ph.D. awarded tend to hover around the $80,000 level though it is higher in some fields (most notably computer & information sciences). Median salaries are less different across Ph.D. science and engineering fields the further from the doctorate one looks.
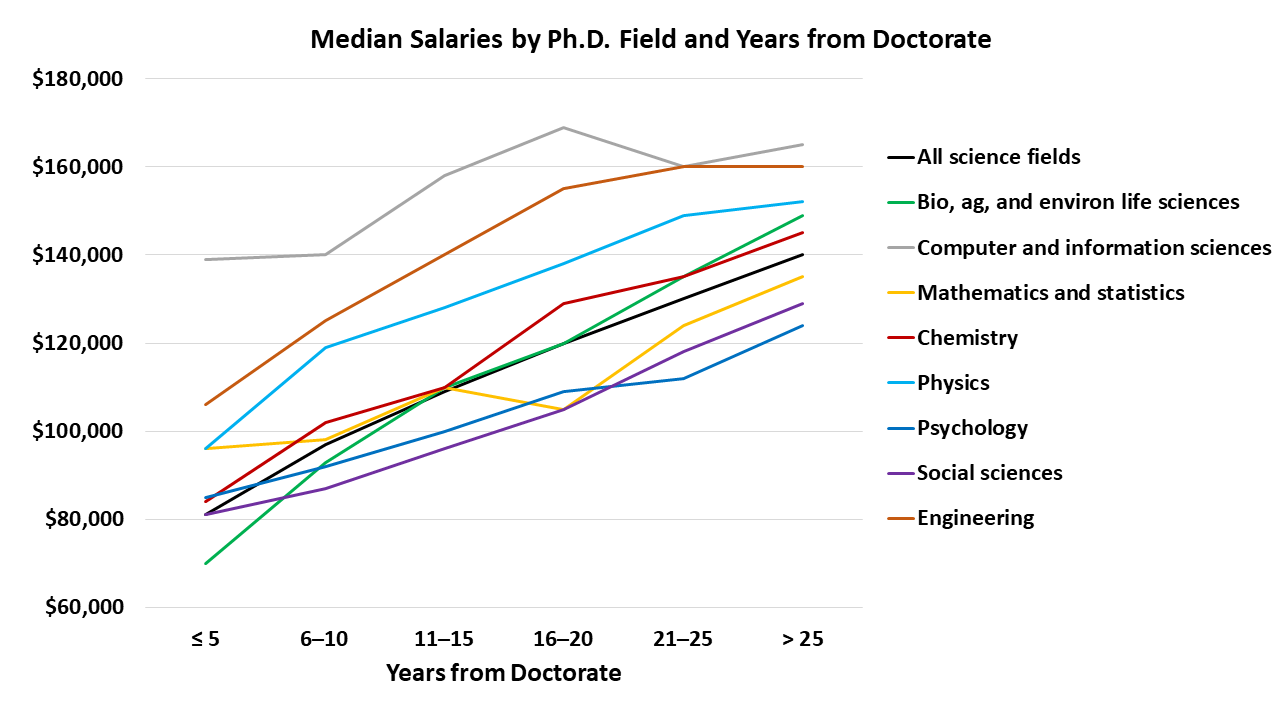
Median earnings for Ph.D.s increase with years of experience.
This final graph nicely illustrates the value Ph.D.s provide to their employers. One could speculate that as individuals with Ph.D. skills including critical thinking, problem solving, and knowledge synthesis also gain work experience post-Ph.D. employers value them more. Fifteen years from receiving their doctorate the median salary for all science & engineering Ph.D.s is $100,000+ and many are making well over that amount. Ph.D. training provides a valuable skillset when coupled with practical experience and knowledge of how to apply those skills through working with diverse employers. Perhaps training programs can do a better job of providing some of the practical skills valued by a variety of employers during graduate school to help aid Ph.D.s' transitions to employment after their degree?
Final Thoughts
The NSF SDR data is an essential tool to help science and engineering graduate students, postdocs, and those who support them understand how the landscape of employment continues to evolve over time. Information on employment sectors and median salary data can also be helpful as recent Ph.D. recipients plot out the next step in their careers and understand their worth.
There are certainly glaring issues that are evident in the NSF data as well. The fact that many Ph.D. recipients <10 years from their degree employed at educational institutions are not in tenure-track faculty or tenured faculty roles speaks to the erosion of the faculty career path for many.
Furthermore, the proliferation of postdoctoral positions and other contingent roles is a problem. And while the number of those who received their Ph.D.s from US institutions officially employed in extended postdoctoral positions (5+ years post-Ph.D.) may be diminishing, we have less data on how many of these individuals have been captured by other job titles (such as research associate) when they "age-out" of the postdoc which may similarly lack pathways to permanent, well-compensated employment.
Certainly there are many unanswered questions in understanding the evolution of the Ph.D. workforce but NSF data provides critical insights which, when collected over time, allows for us to begin to observe changes in various employment metrics.
I encourage you to explore the data for yourself at the links below.
For Further Reading
- PhD Recipients' Employment Trends: Insights from NSF Data
- The Challenges of Being an International Researcher: Implications for Advanced Degree Labor Markets PART 1 & PART 2
 RSS Feed