Scientific Workforce, Job Search, Opinion
I have written about weighing the value of pursuing a postdoc after completing your Ph.D. in a previous blog post. And while that post focuses on my own personal experience and opinion, I wanted to use this space to emphasize more practical advice on how to network your way to postdoc opportunities and consider the training environment in the lab/group/institution to make the most of your postdoctoral experience.
I am often asked by Ph.D. students how they should search for postdoc positions and make the most of them. Recently, I gave a presentation on the topic to a graduate class at North Carolina State University. I am sharing it here for those of you debating should you do a postdoc, how to find a good postdoc environment, and how to make the most of this training period.
I am often asked by Ph.D. students how they should search for postdoc positions and make the most of them. Recently, I gave a presentation on the topic to a graduate class at North Carolina State University. I am sharing it here for those of you debating should you do a postdoc, how to find a good postdoc environment, and how to make the most of this training period.
Updated 8/8/2023
In Fall 2022 as part of my role managing the Office of Postdoctoral Affairs at Virginia Tech, I offered a series of workshops on "Pursuing a Postdoc Proactively". I am sharing the slides from those sessions, linked below, with the larger academic community to help Ph.D. students consider if a postdoc is right for them, what types of postdocs exist (in academia and beyond), and the importance of early reflection and networking in securing an academic postdoc position.
The presentations focused on:
Why Postdoc?
- In this session, I cover the objectives of a postdoctoral position and why an individual may consider pursuing one. As part of the session, participants engaged in self reflection around their current training and career goals and worked to articulate whether postdoctoral training serves these goals.
Expand your horizons - Postdoctoral positions outside academia
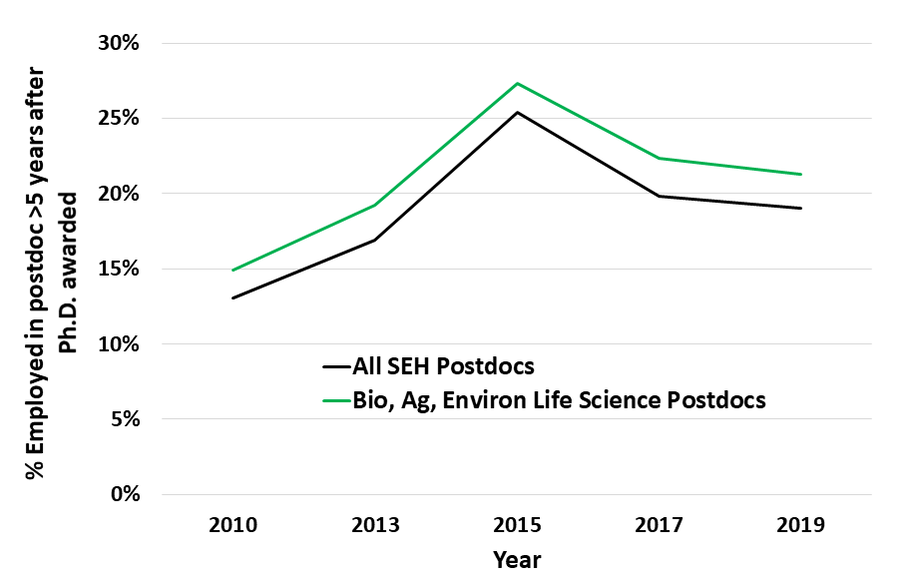
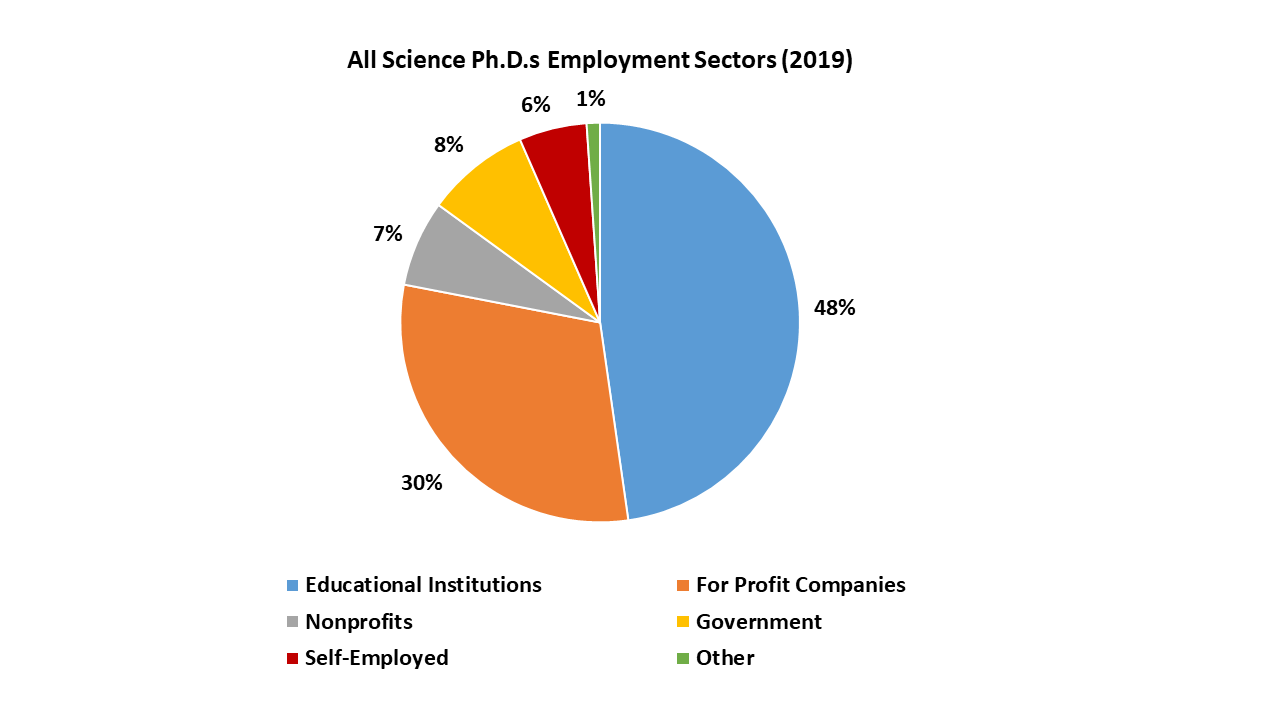
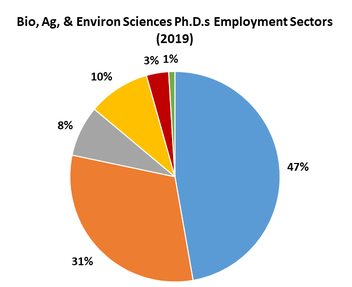
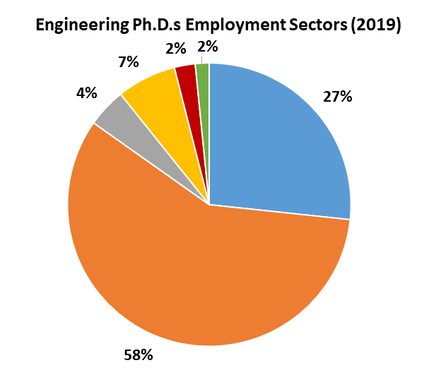
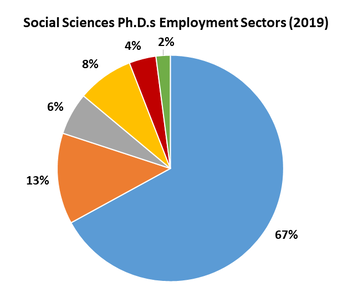
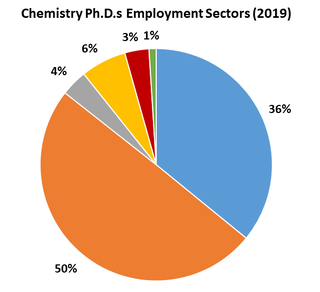
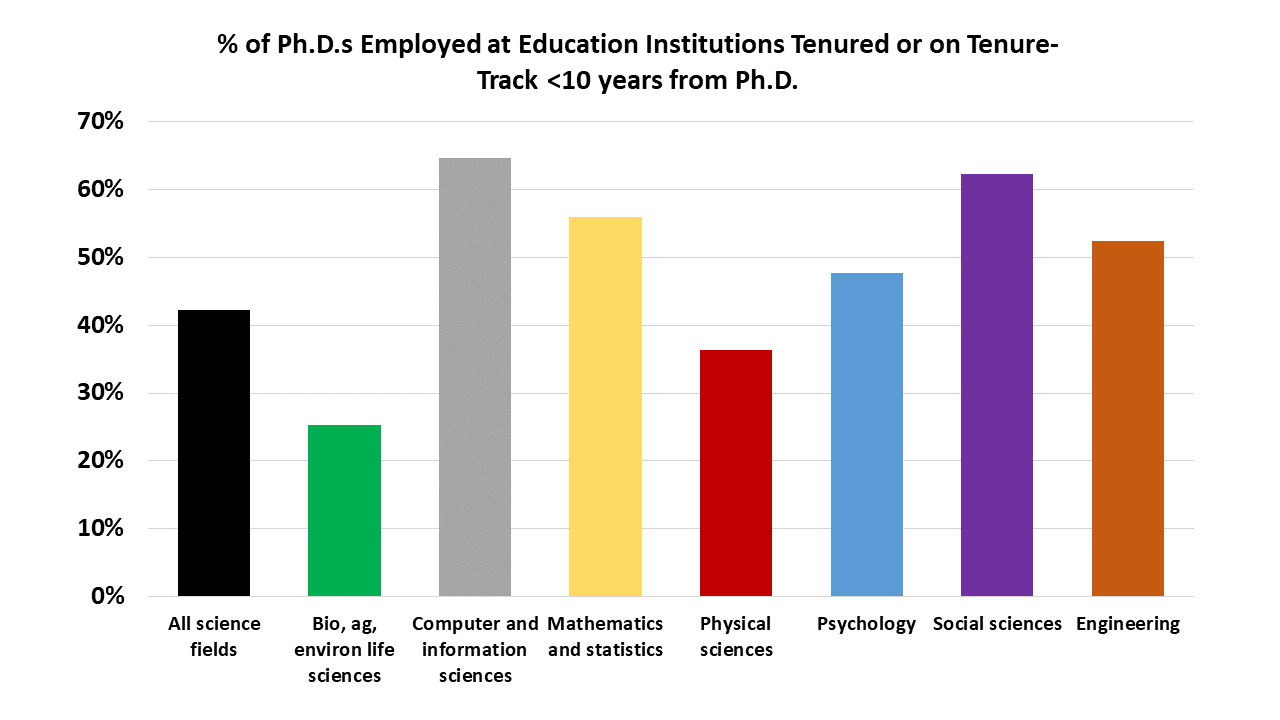
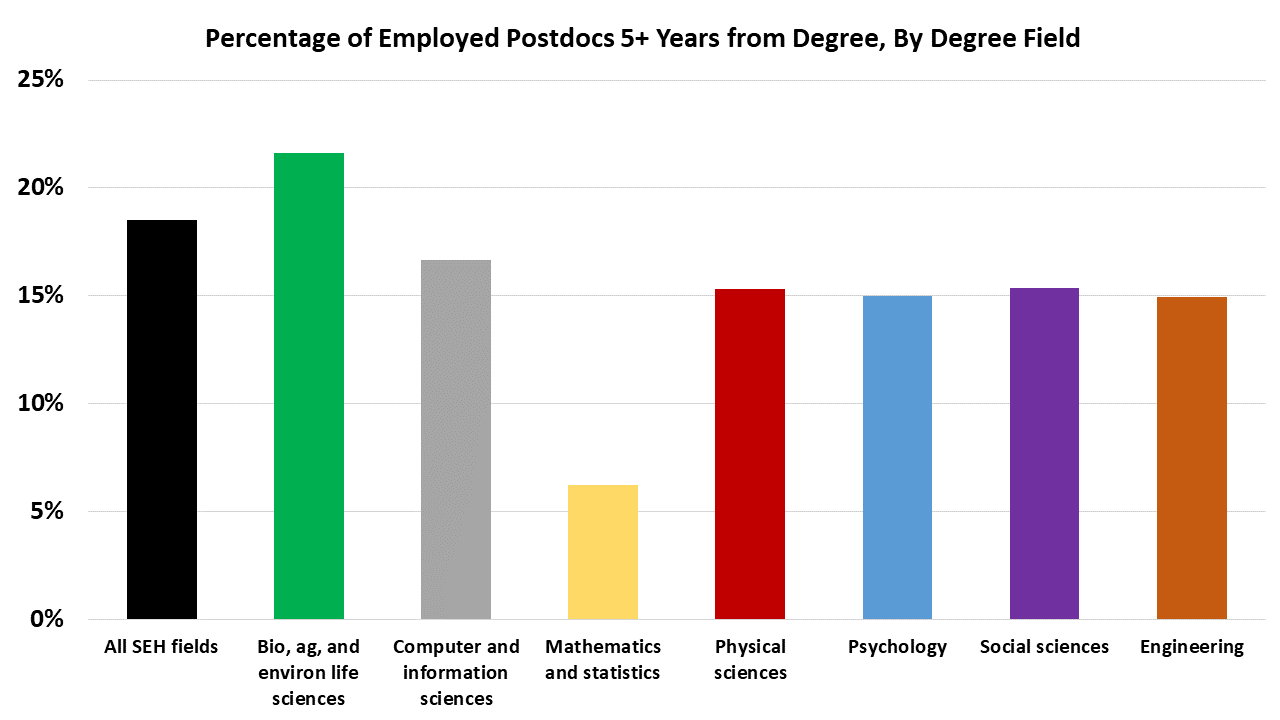
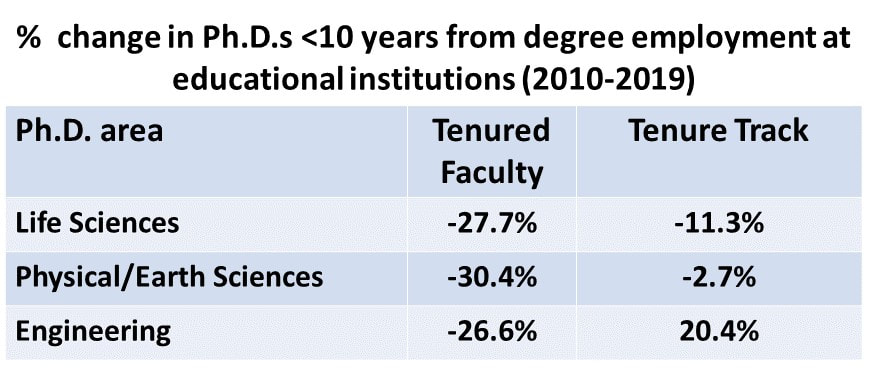
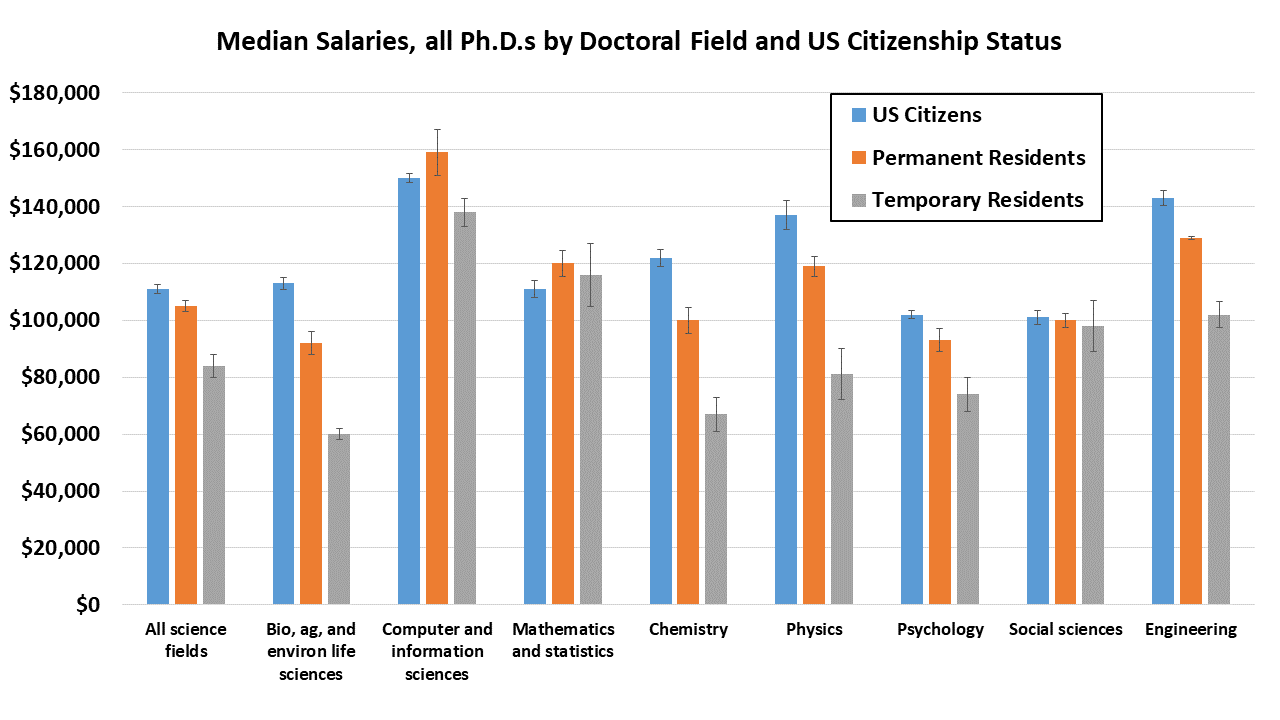
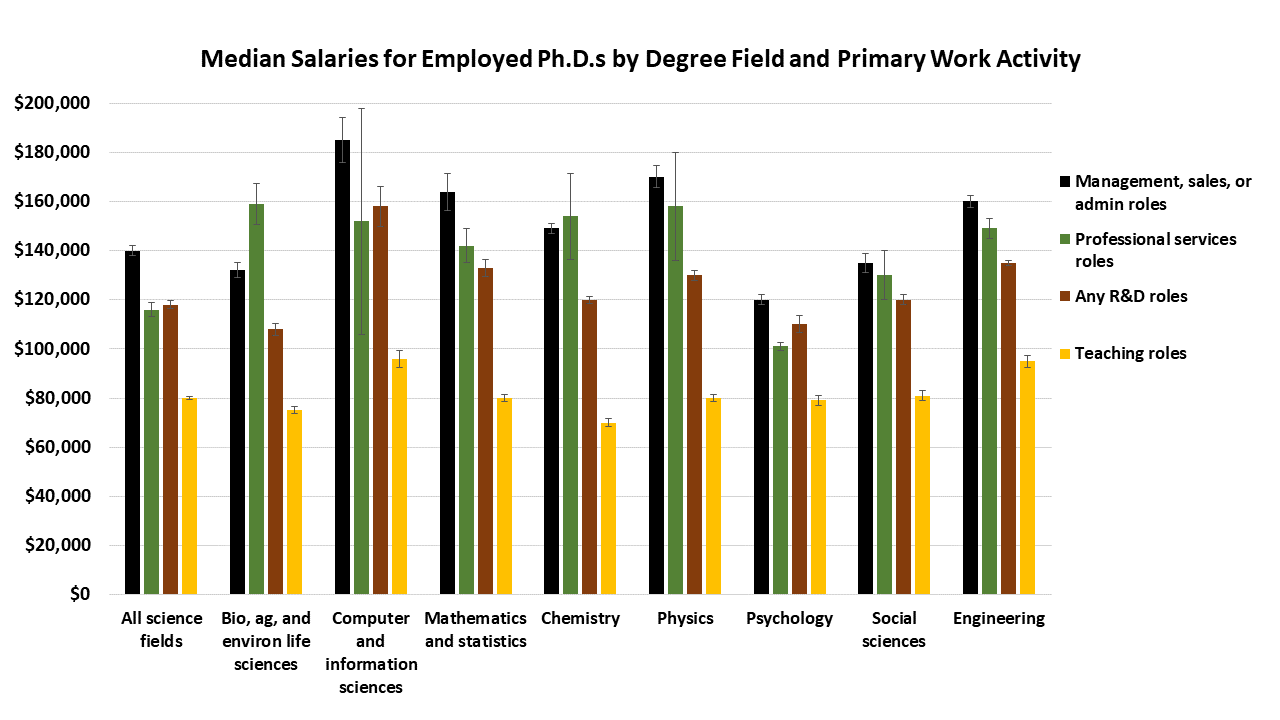
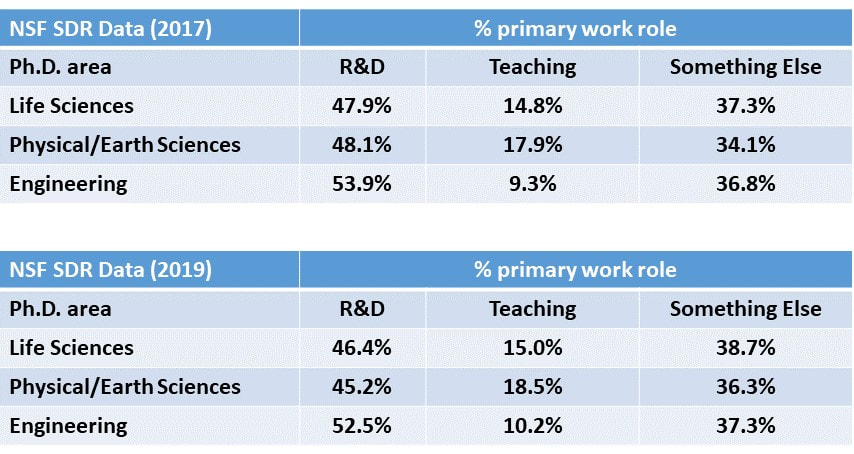
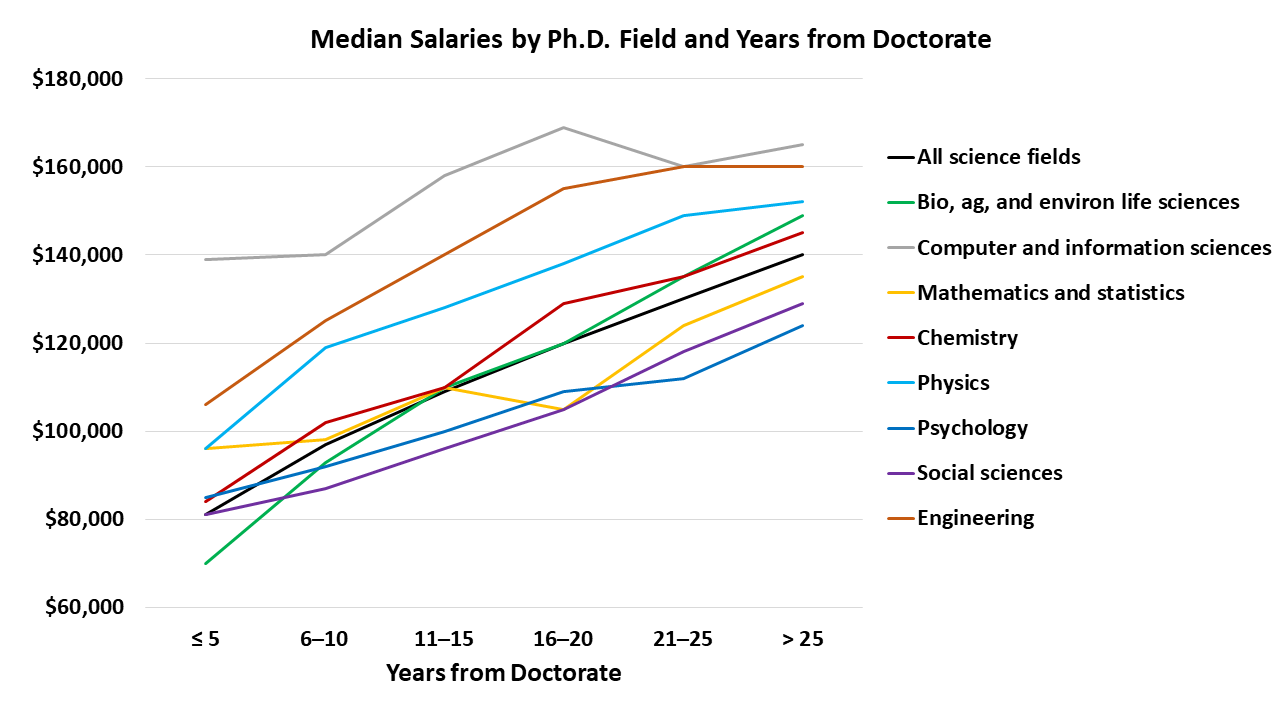
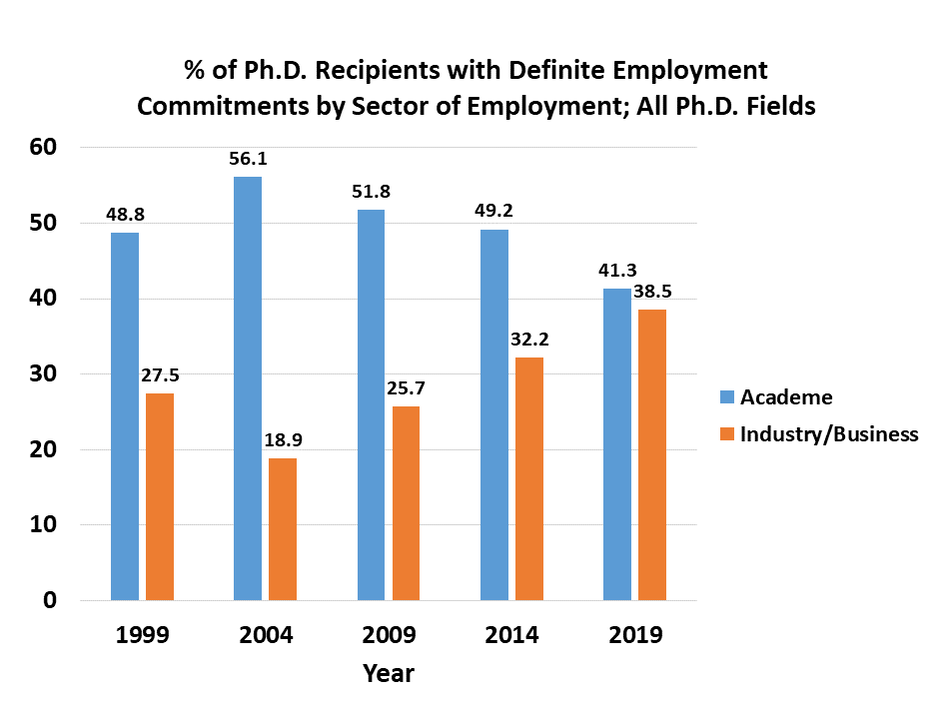
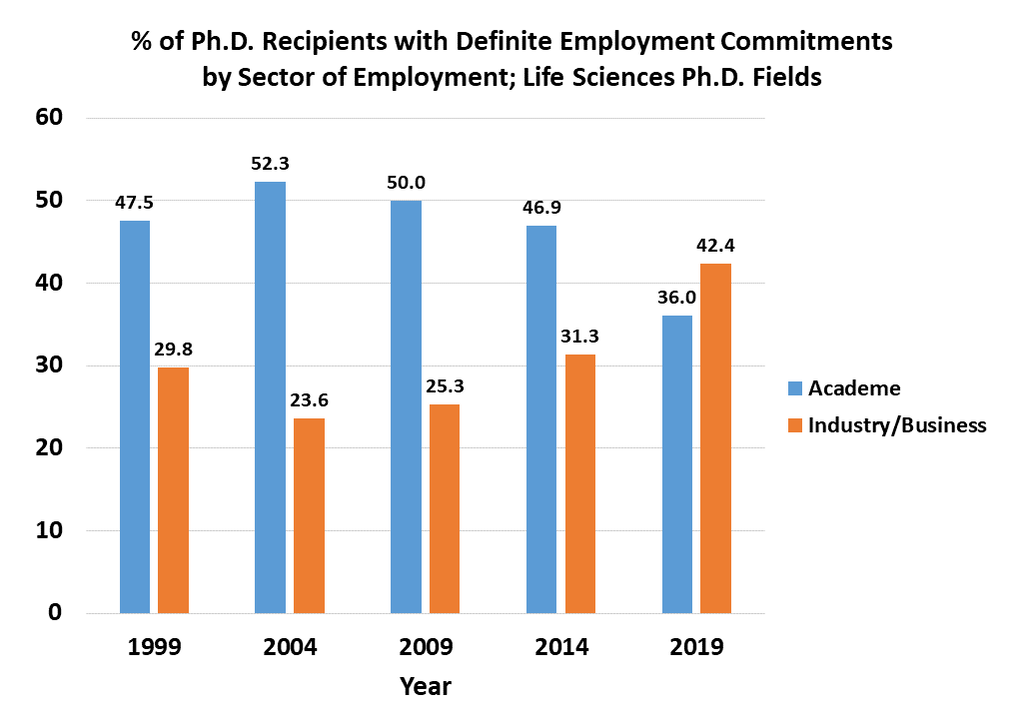
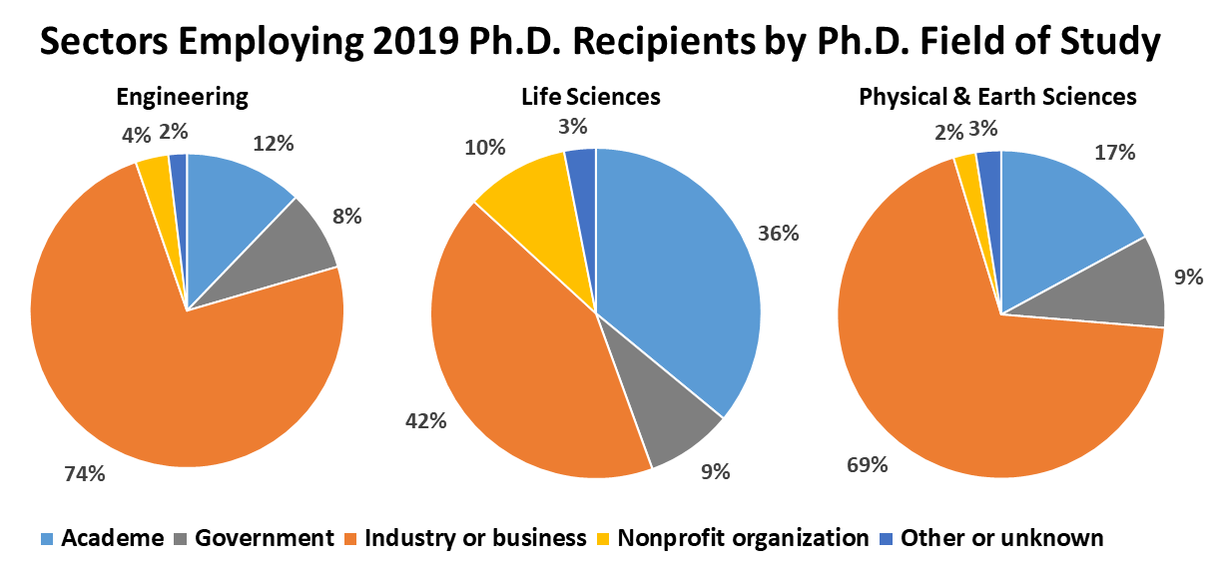
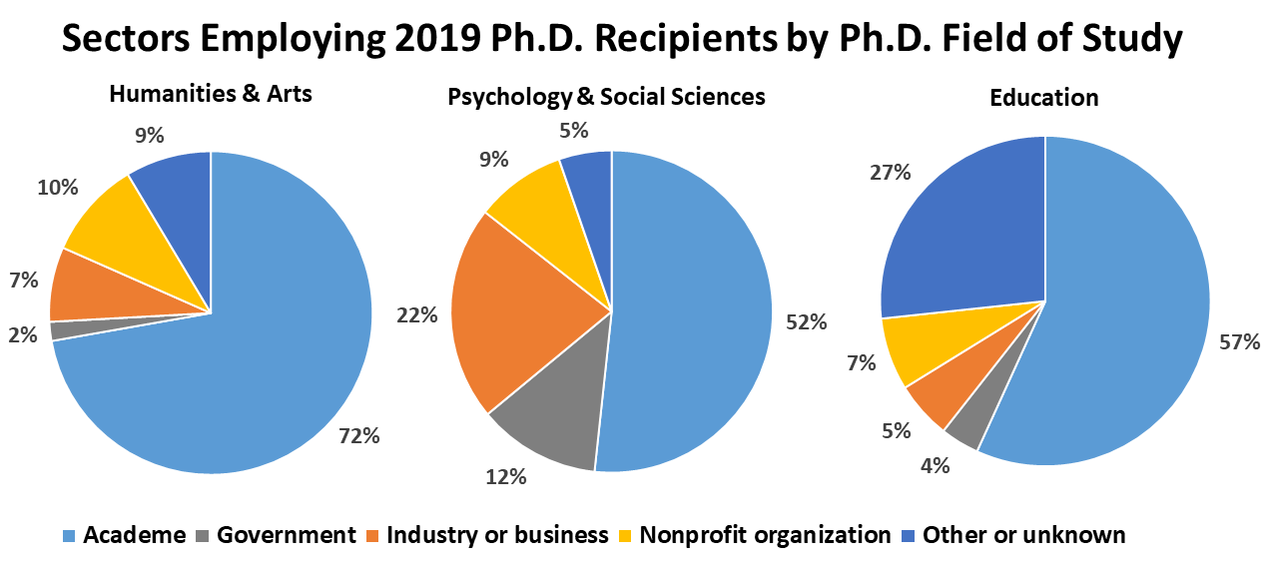
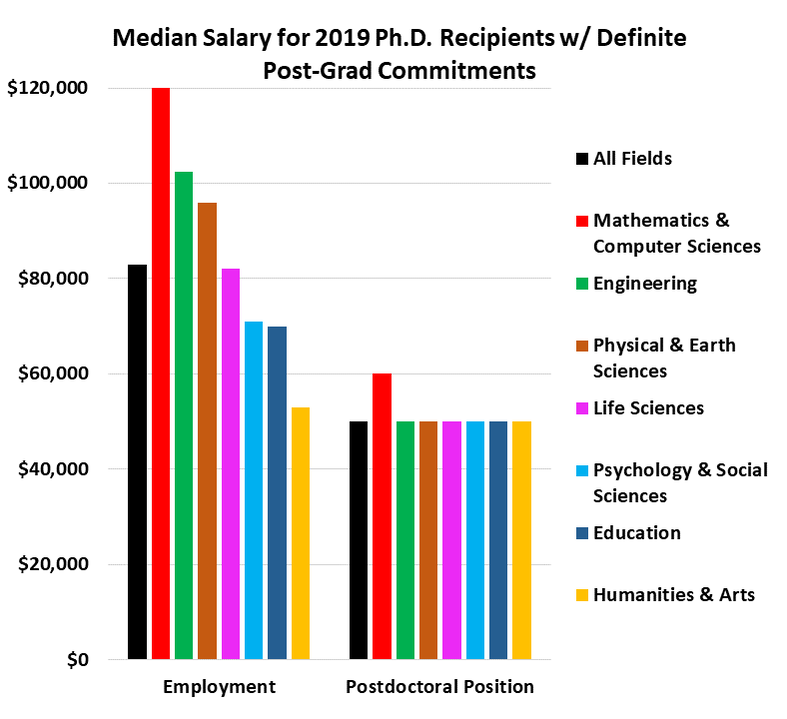
- This session was grounded in work by Virginia Tech Engineering Education Associate Professor David Knight’s PLoS One paper: U.S. postdoctoral careers in life sciences, physical sciences and engineering: Government, industry, and academia. The workshop began with an overview of data on the career trajectories and earnings for both life sciences and physical sciences and engineering graduates pursuing postdocs in academia, industry, and government. The second half of the session provided an overview of common options for postdocs outside academia including at the National Laboratories, via government agencies, and in industry.
Finding and vetting a postdoctoral position
- In this session, we discussed the importance of the training aspect of the postdoctoral position and covered specific components of the environment one should consider before accepting a postdoc position. In addition, we discussed practical tips a Ph.D. student can use to expand their network to not only learn of postdoctoral opportunities but to also assess the fit and relevance of potential opportunities to their needs.
The Strategic Postdoc Course
iBiology has an excellent FREE online course entitled "The Strategic Postdoc"
Module 1: Positioning Yourself for the Postdoc
This module will help you identify your needs, preferences, and values (NPVs) to reverse-engineer your postdoc search. Using videos, case studies, worksheets, and reflection questions, you will build a game plan to leave your PhD and secure your ideal postdoc.
This module will help you identify your needs, preferences, and values (NPVs) to reverse-engineer your postdoc search. Using videos, case studies, worksheets, and reflection questions, you will build a game plan to leave your PhD and secure your ideal postdoc.
Module 2: Applying for and Choosing the Right Postdoc
This module will guide you through the process of finding, interviewing, and choosing a postdoc lab that is a good fit for you. You will also learn how to apply effective negotiation strategies to help you smoothly transition out of our PhD lab and into the next stage of your career journey.
This module will guide you through the process of finding, interviewing, and choosing a postdoc lab that is a good fit for you. You will also learn how to apply effective negotiation strategies to help you smoothly transition out of our PhD lab and into the next stage of your career journey.


 RSS Feed