Ph.D. Career Pathways, Scientific Workforce, Job Search
A version of this post originally ran in Inside Higher Ed's Carpe Careers column in October 2023

Doctoral students nearing the end of their degree program must anticipate transitioning from graduate work—finalizing data analysis, writing and completing a dissertation—to searching for postgraduate opportunities. For many of you, especially those in the sciences, the next step is often an academic postdoctoral position to bolster your skills and research experiences as part of your career and professional advancement.
A previous Carpe Careers post in Inside Higher Ed by Tina Solvik provided expert advice for finding academic postdoctoral positions and what you should consider during the process. We will highlight in this piece additional resources and programs that you may want to leverage for identifying and transitioning into a postdoctoral opportunity, whether your career goal is a faculty position or employment in the for-profit sector or government. While there are several different types of postdoc experiences, you should always concentrate on developing new technical capabilities beyond graduate training; seeking opportunities for more independence in research; and gaining skills in leadership, project and people management, and mentoring.
For many doctoral students nearing the completion of their degree, the question often becomes: to postdoc or not to postdoc…and where? Like all complex questions, the answer is: it depends. To determine what a postdoc would mean for your career, you should consider the costs and benefits of the time spent in such a position as well as explore other possible paths.
Here are two ways to begin that reflection process.
1. Find job advertisements for career positions that are of interest. Do they require postdoc experience? Is it a preferred criterion? If so, then you should probably consider a postdoc.
2. Seek advice from your network and engage in informational interviews with professionals in positions similar to what you want to obtain to determine if postdoc experience is necessary to get the jobs they have.
While few positions outside faculty roles require or prefer postdoctoral experience, leveraging a postdoc to build skills and crystalize your career plans can still be worthwhile.
State of the Postdoc Across Disciplines
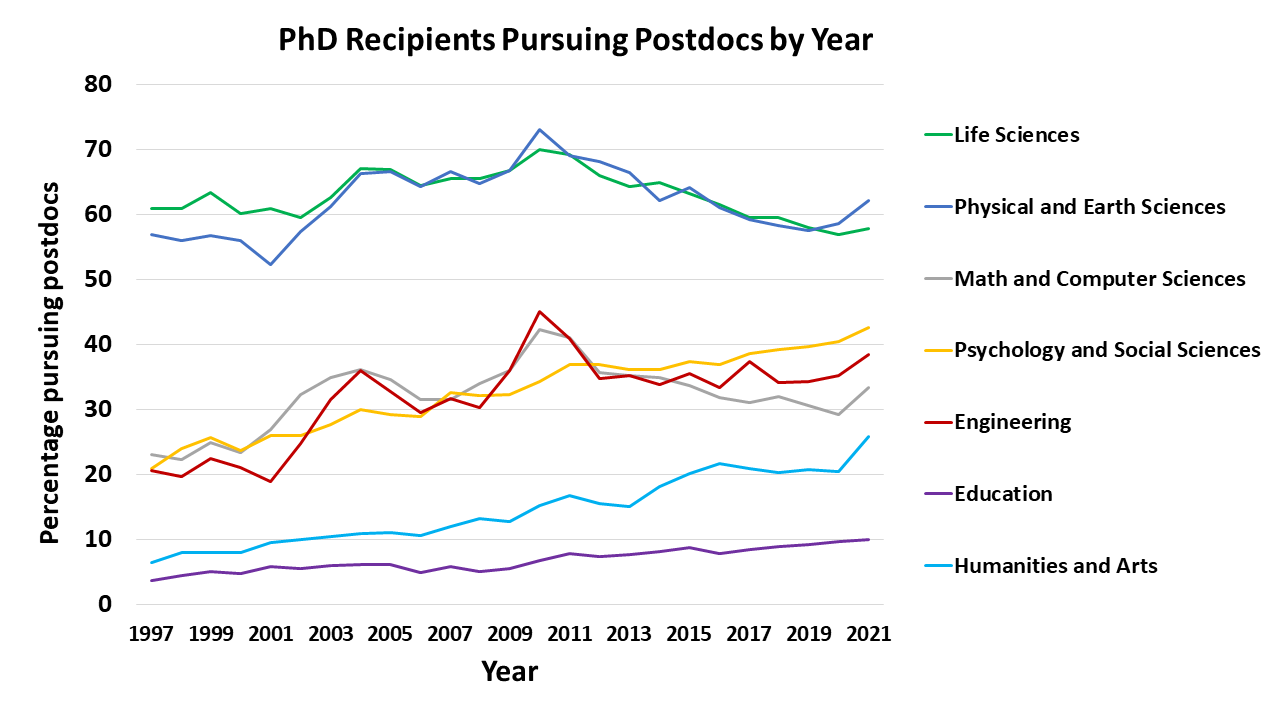
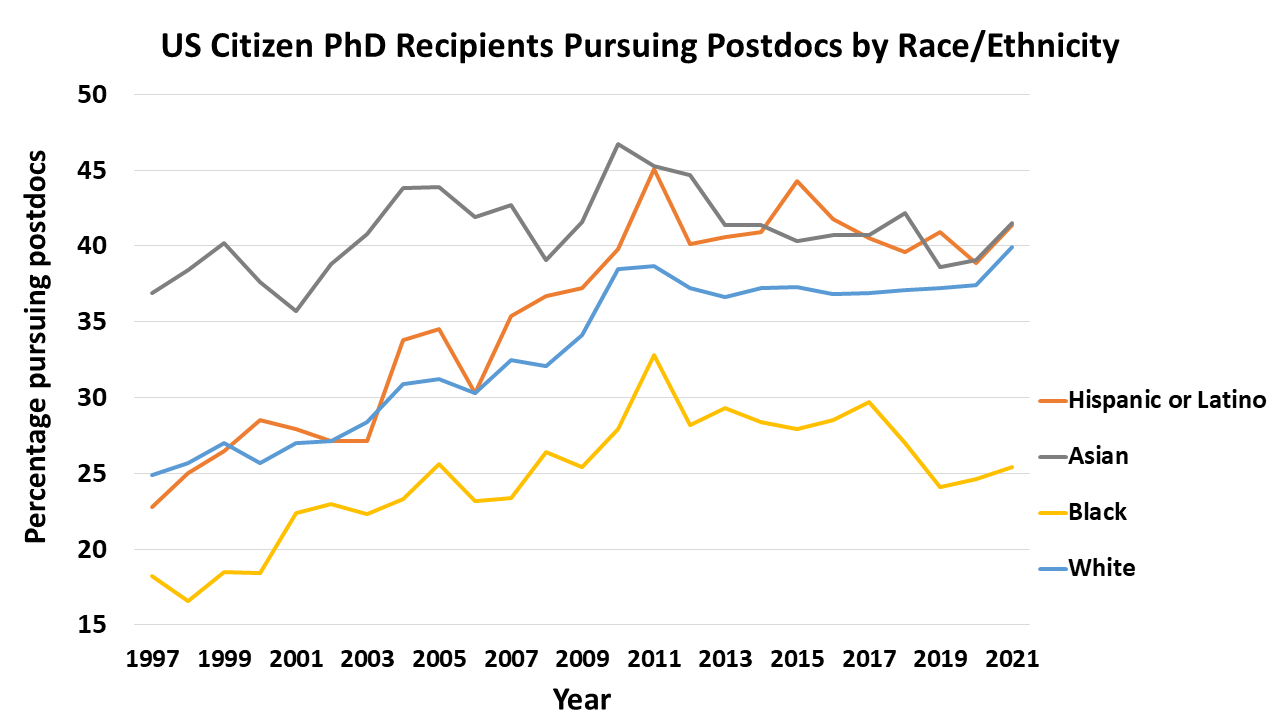
Historically, postdoc positions have been mainly available in STEM fields, but they have become more common recently in the humanities and social sciences. The graph below shows the steady growth of recent Ph.D.s in the humanities and arts, education, and psychology and social sciences pursuing a postdoc after graduation. From 2010 to 2022, the number of people seeking a postdoc grew 62 percent in the humanities and arts, 60 percent in education, and 26 percent in psychology and the social sciences.
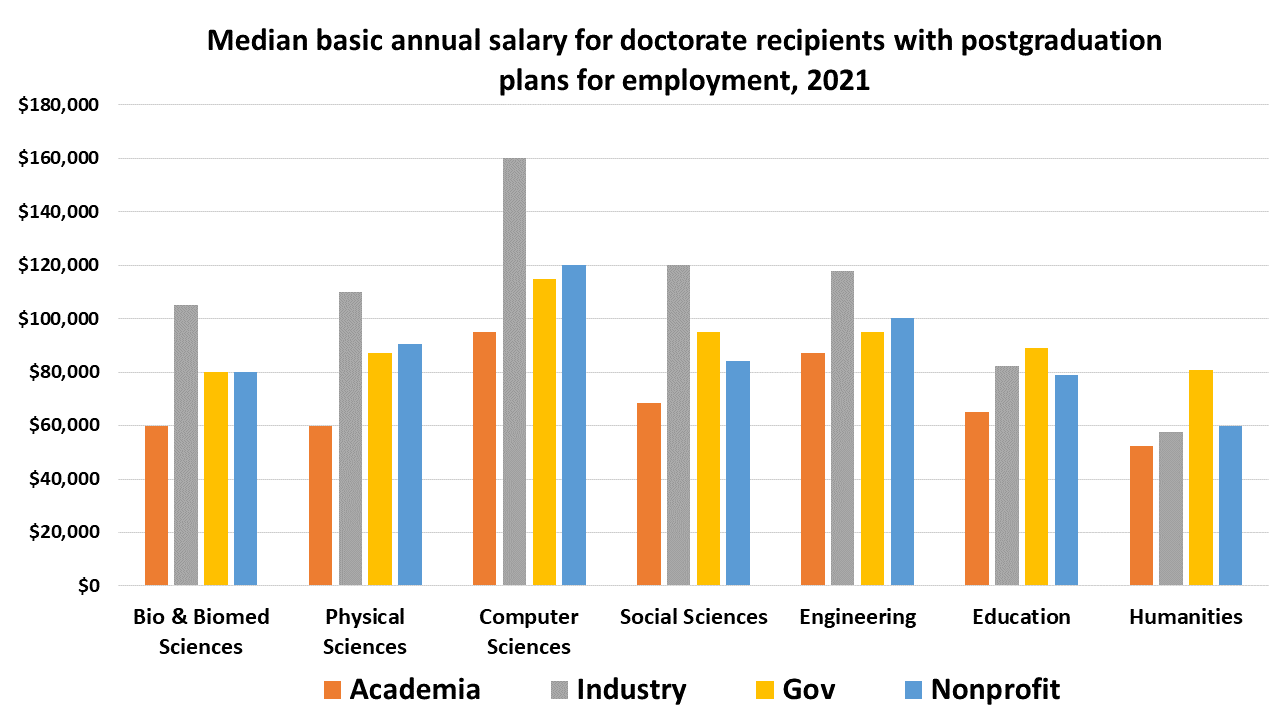
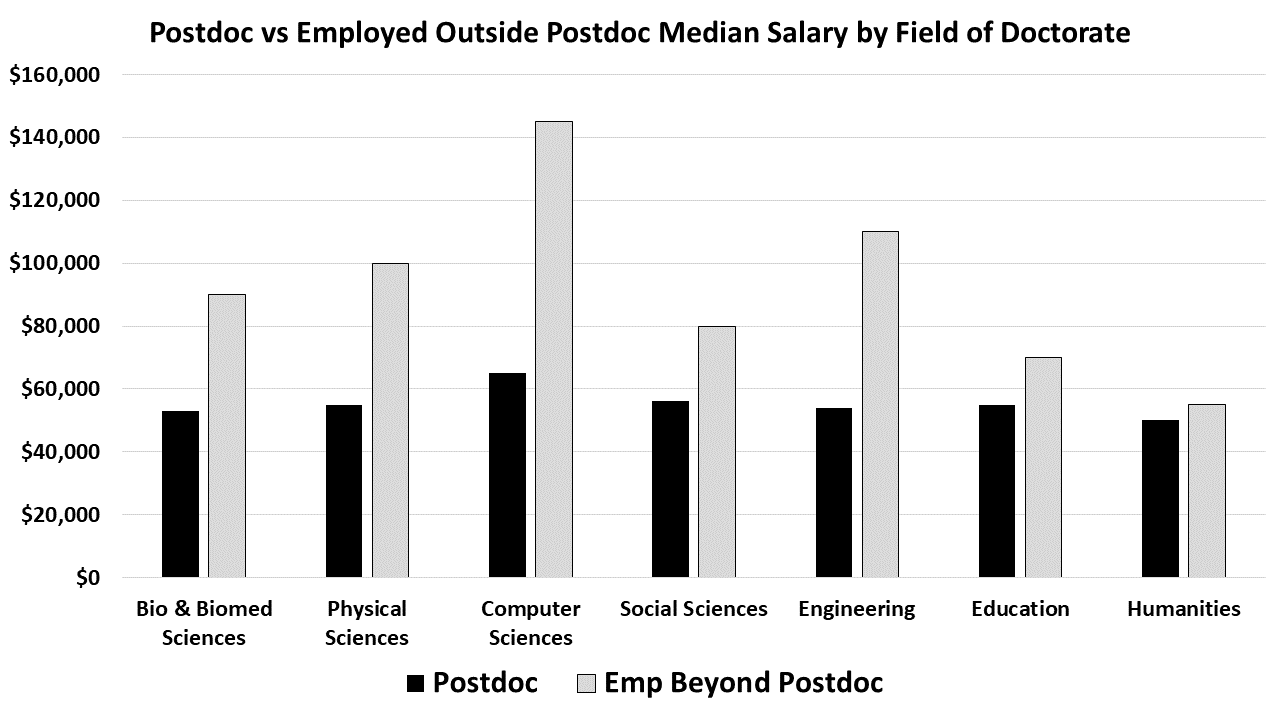
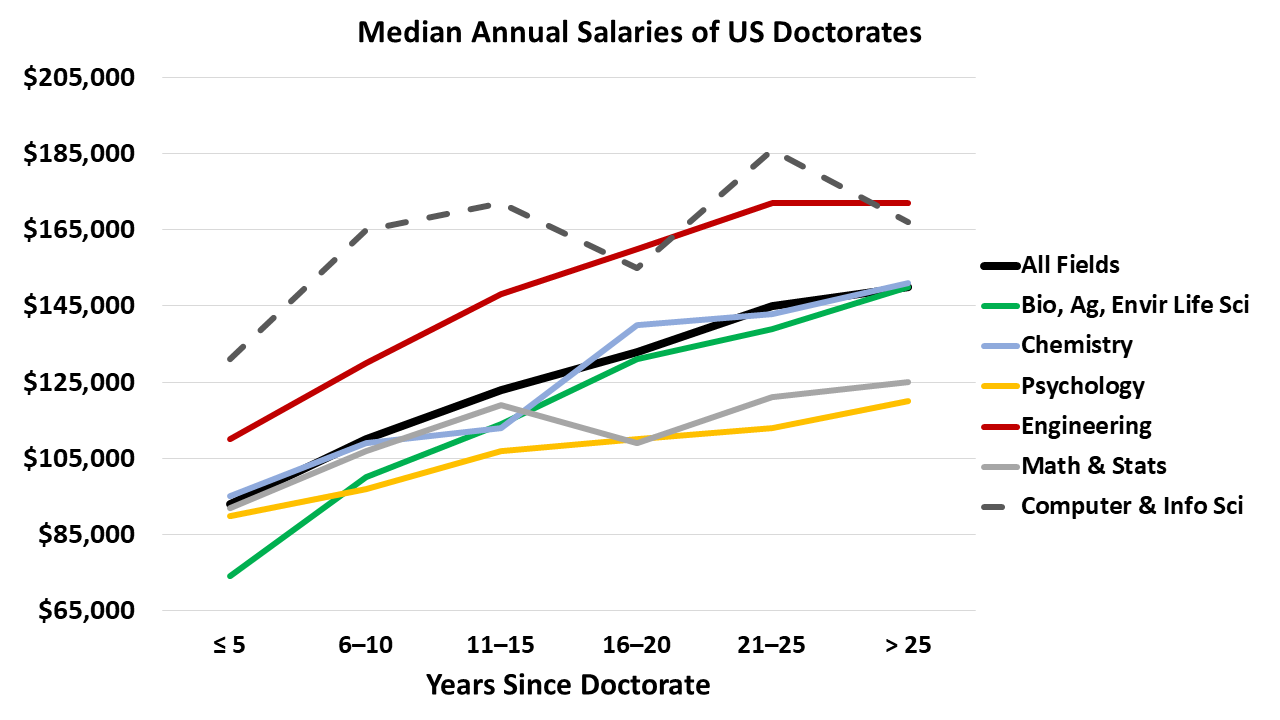
That said, one major disadvantage is that postdoctoral training decreases earnings and delays retirement savings, according to a study by Shulamit Kahn and Donna K. Ginther. So, while a postdoc can help you build skills and expand scholarly experiences that help you advance your career, you may pay a short-term financial cost.
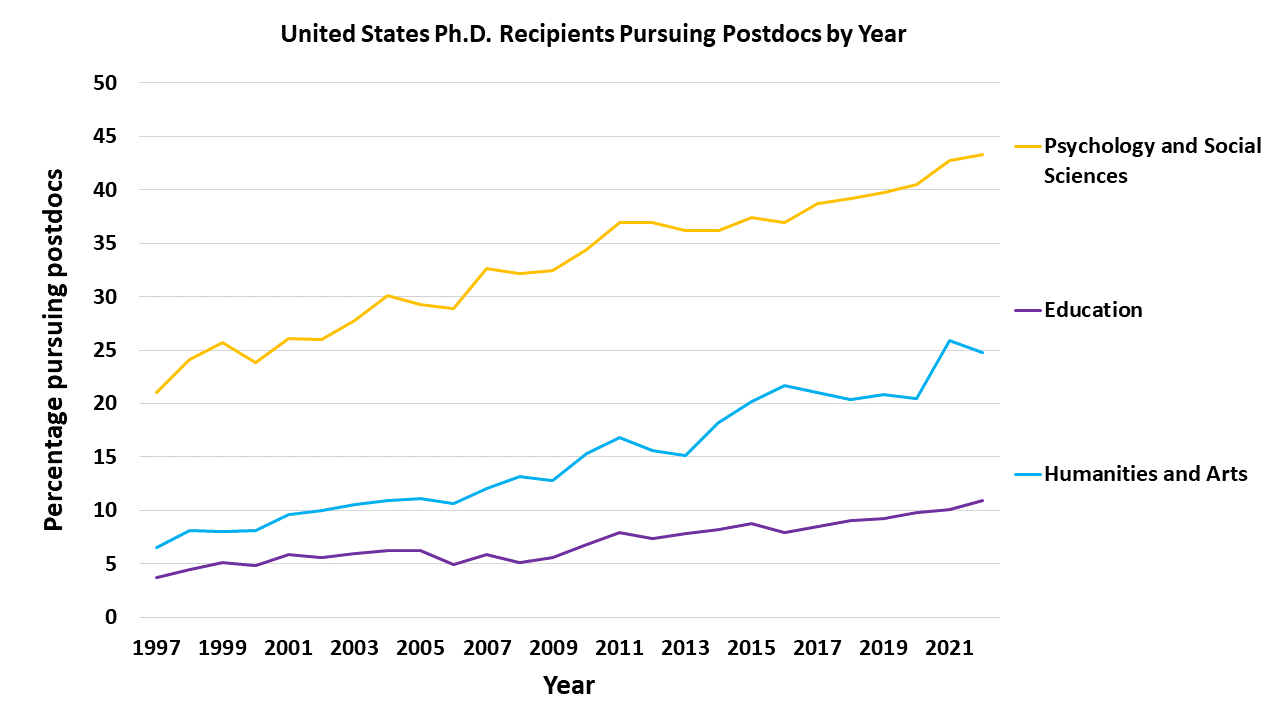
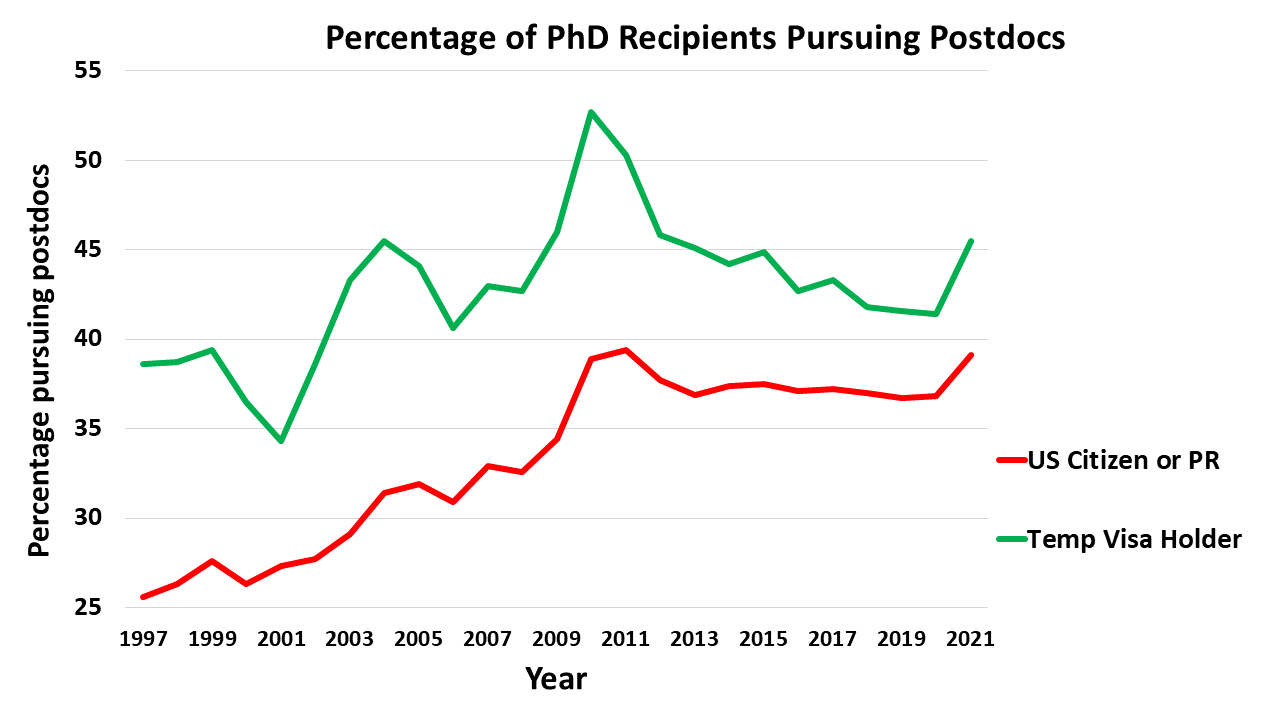
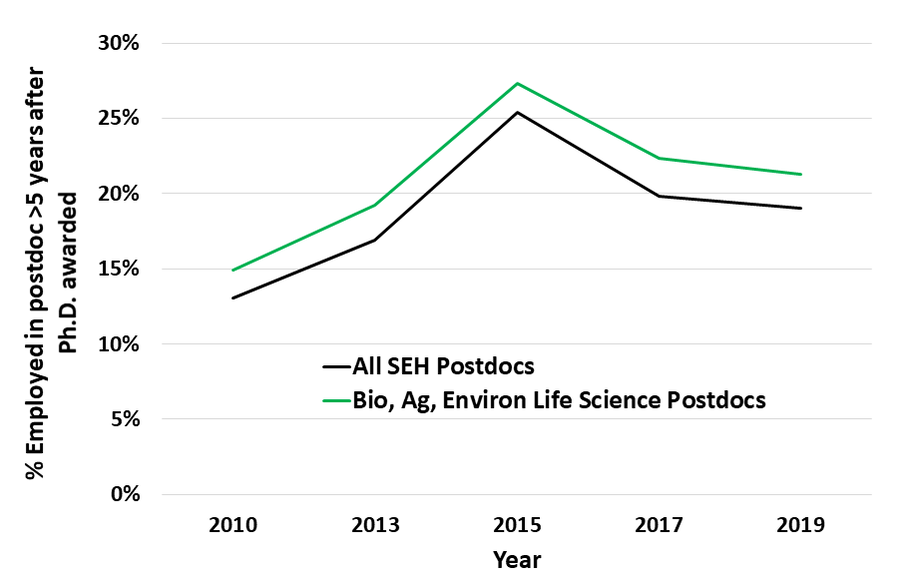
National Science Foundation Survey of Earned Doctorates (SED) data. Percentage of Ph.D. recipients pursuing postdocs each year from 1997 to 2022.
Finding Postdoc Opportunities
Choosing the proper postdoctoral training environment will be vital to your success. We highly recommend The Postdoc Academy, a free, online series of courses and resources, for anyone planning to transition from graduate work to a postdoc position. Its content focused on succeeding as a postdoc and creating productive conversations with a potential postdoc mentor may be especially relevant.
- The next online Succeeding as a Postdoc course begins March 18, 2024, and those interested engaging with a learning community to discuss the online content can register to join a community (or PALS) here.
- For those searching and interviewing for postdoctoral positions and navigating the end of their Ph.D., I highly recommend the online course "The Strategic Postdoc" available from iBiology.
You should consider a variety of environments for your postdoctoral training. Learning about postdoc opportunities is part of networking. So it’s best to reach out to other researchers in the field you’re interested in and anticipate when open postdoc opportunities might occur. Many people who pursue a postdoc are ultimately seeking faculty careers and, as such, working at an academic institution as a postdoc can help you better prepare for succeeding in that space.
The vast majority of postdoctoral positions in academia are funded via external grant awards. Therefore, it can be helpful to use tools like NIH Reporter, NSF Awards Search, USDA NIFA Awards Search, and National Endowment for the Humanities to identify faculty working in your area of interest who may also have funding available to support you as a postdoc. While you may be primarily hoping to find faculty members with pending funding to support you in the future, if someone already has funding in an area, it usually a good predictor that more funds may be available. Proactive outreach to faculty who are doing work that interests you can help you explore a potential alignment of a pending grant with the timeline of your postdoc search.
The number of opportunities for commercialization or technology transfer postdoc positions at U.S. universities is also growing. Those programs either focus on training Ph.D.s for careers in the technology transfer space or assist in learning how to commercialize technology or other innovations coming from research work.
If you are in the humanities, consider postdoc opportunities at universities, centers, libraries and institutes—especially if your interests are interdisciplinary and applied. Humanities Ph.D.s can find postdoc opportunities in fields such as digital humanities, public humanities, and science and humanities by searching this academic jobs wiki. These opportunities can give you the chance to work on cutting-edge research and develop new skills in different contexts.
Keep in mind that you can also find a variety of opportunities to build skills and experiences in a mentored training position in environments other than academic institutions. If you are interested in a more research-focused career path or one where your research deals with applied questions, postdoc positions at U.S. Department of Energy’s National Laboratories and similar organizations could be worth exploring. The platform Zintellect, managed by the Oak Ridge Institute for Science and Education, allows you to search for postdoc fellowship positions (and other roles) at multiple national labs and federal agencies. The NRC Research Associateship Programs are another great way to gain postdoc training in a U.S. government research lab or agency. In addition, the American Museum of Natural History, the National Park Foundation, the Smithsonian Institution, and companies like GlaxoSmithKline and the American Association for the Advancement of Science offer a variety of postdoc opportunities in nonacademic contexts.

Opportunities Abroad and for International Scholars
As we become a more global society, it’s worth considering positions at academic and research institutions across the world. Collaborating across different contexts and cultures can be an enriching experience as part of your career trajectory. EURAXESS is a comprehensive platform for connecting talented researchers with postdocs and research opportunities in the European Union while also providing a range of online career development resources. The Marie Skłodowska-Curie Actions Postdoctoral Fellowship program also supports postdoctoral training in Europe or globally for nationals and residents of European Union member states.
For foreign scholars considering postdoc opportunities in the United States, it’s important to learn as much as possible about the transition process. Moving to the United States for a postdoc can be a big adjustment. When deciding whether or not to do so, be sure to factor in the cost of living, the climate and the cultural differences. The National Postdoctoral Association provides a range of resources for international scholars, including quick guides to visas and income taxes. It also offers an Onboarding for International Postdocs guide that can be helpful for scholars moving to the U.S. for their postdoc and for the offices at U.S. institutions that support postdocs.
In conclusion, whether you decide to pursue a postdoc in academia, industry or government—or forgo one entirely—I hope you approach your post-Ph.D. career with intention. The postdoc training period can help you advance in many career paths that are satisfying and exciting, and that lead to new opportunities in the future.


 RSS Feed