Ph.D. Career Pathways, Scientific Workforce
The National Science Foundation (NSF) in the United States collects two surveys of doctorate recipients that seek to better illuminate and understand Ph.D. career pathways.
- The Survey of Earned Doctorates (SED) is an annual census conducted since 1957 of all individuals receiving a research doctorate from an accredited U.S. institution in a given academic year. The 2021 SED data was released in October 2022 and is currently the most up-to-date data available. Data from the 2022 SED will be released in October 2023.
- The Survey of Doctorate Recipients (SDR) provides demographic, education, and career history information from individuals with a U.S. research doctoral degree in a science, engineering, or health field. It seeks to capture a snapshot of the doctoral workforce by surveying PhD holders across a range of ages and is administered every two years. The 2021 SDR data was released in January 2023. New SDR data will be collected in 2023 and reported in 2025 most likely.
Given the popularity of my previous blog posts examining the 2019 SDR and 2019 SED data, I thought revisiting these surveys and sharing the most up-to-date insights from them would be helpful to graduate students, postdocs, and those who support them. The data give us a good snapshot of the scientific workforce, hiring trends, and salary data for recent Ph.D.s and more experienced individuals holding a doctoral degree.
Postgraduate Commitments for Doctorate Recipients by Field
The SED asks recent doctorate recipients each year if they have "post-graduation commitments", which could include employment being secured or a postdoctoral position arranged. We can look at this data by the field of doctorate and over time to observe trends in post-graduation commitments. I pulled data from the past 25 years of the SED (from the 1997 to 2021 data) and plotted the trends in post-graduation commitments by field, below.
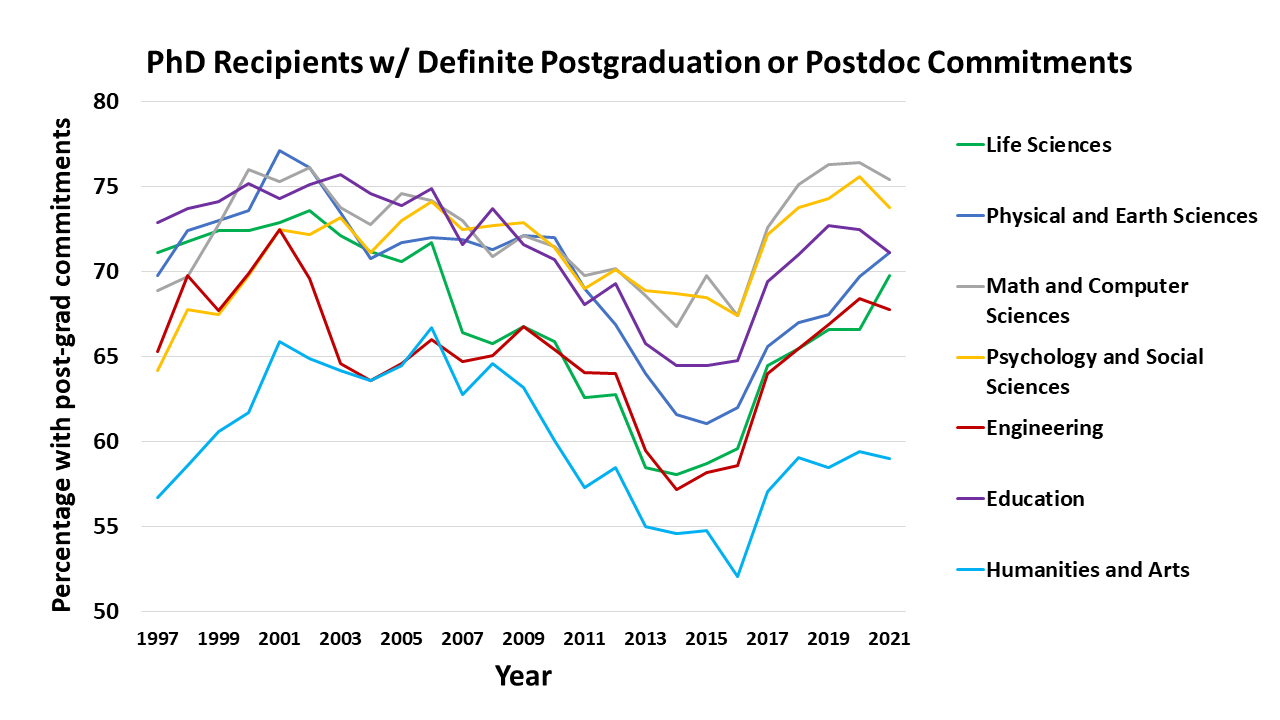
These data reveal some interesting patterns. First, and perhaps not surprisingly, the humanities and arts fields have lower post-graduation or postdoc commitments than engineering, science, or the education fields. Math and computer sciences have historically seen the highest level of post-graduation commitments. The average percentage of PhD recipients with post-graduation commitments in 2021 was 70%, unchanged from 2020 data. The yearly low point for this percentage across the 25 years analyzed was in 2014 when across all fields the post-graduation commitment rate was 61.4%.
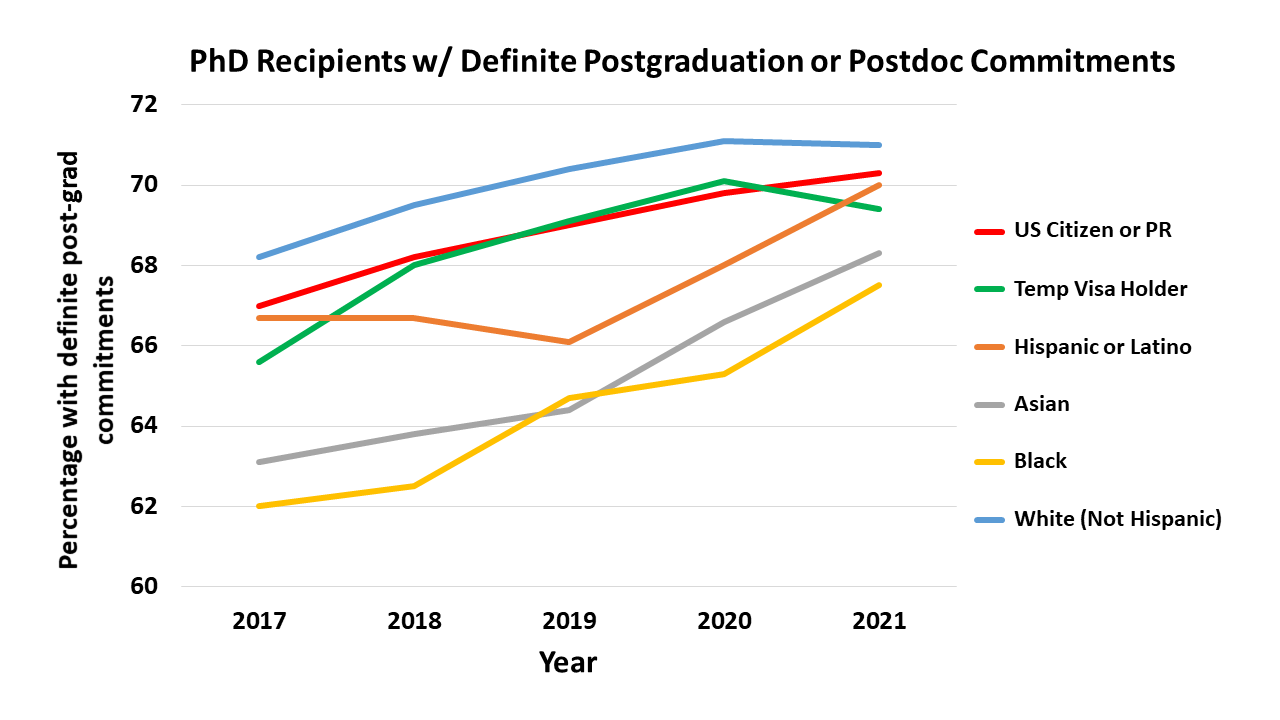
If we zoom into the past 5 years of SED data we see that for many fields, the percentage of recent Ph.D.s with post-graduation or postdoc commitments has increased from 2017 to 2020 and continued to do so from 2020 to 2021, specifically in the life sciences and physical & earth sciences.
If we zoom into the past 5 years of SED data we see that for many fields, the percentage of recent Ph.D.s with post-graduation or postdoc commitments has increased from 2017 to 2020 and continued to do so from 2020 to 2021, specifically in the life sciences and physical & earth sciences.
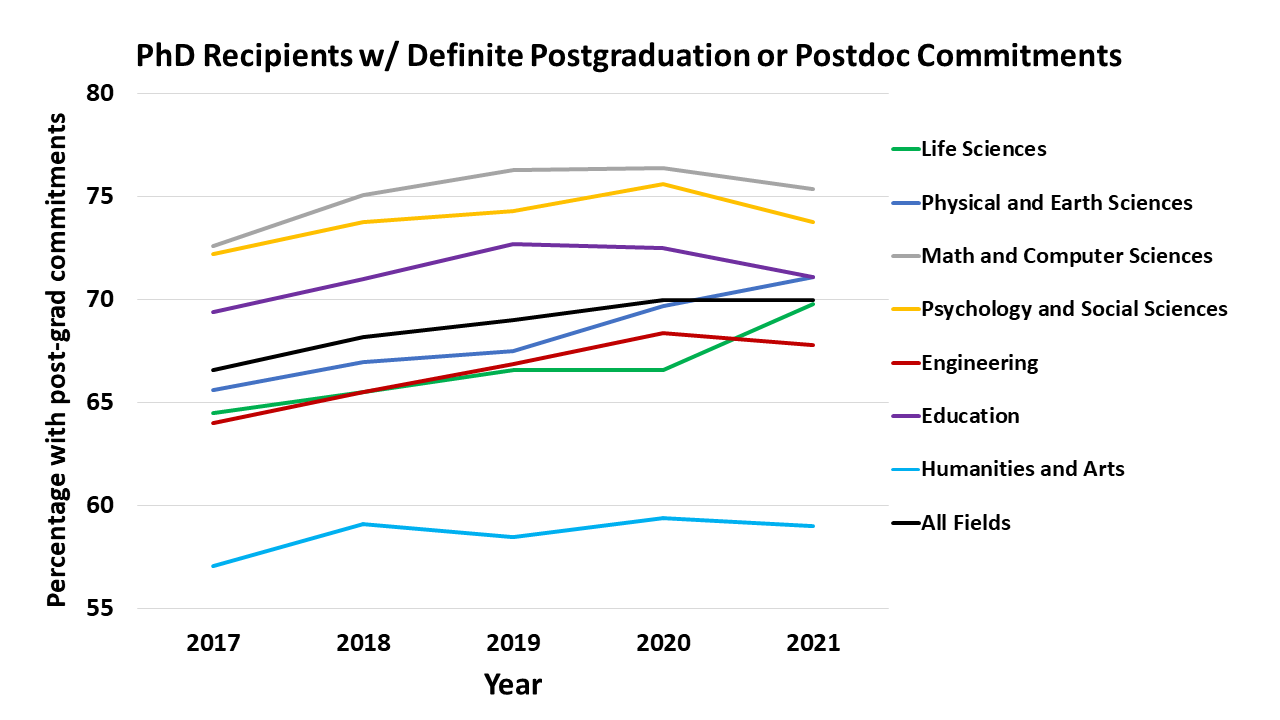
In fact, from 2020 to 2021, the percentage of life science doctorates with definite post-graduation commitments increased by 4.8% while the percentage increase was 2.0% year-over-year for the physical and earth sciences. Other fields showed modest decreases of -1% or -2% in post-graduation commitments from 2020 to 2021.
What I find interesting in these data is there is virtually no sign of the COVID-19 pandemic (that began in Spring 2020 and lasted well into 2021) impacting these numbers. It will be interesting to see the 2022 SED data when it is released in October to see if the pattern of stable or growing post-graduation commitments over the past few years persists.
What I find interesting in these data is there is virtually no sign of the COVID-19 pandemic (that began in Spring 2020 and lasted well into 2021) impacting these numbers. It will be interesting to see the 2022 SED data when it is released in October to see if the pattern of stable or growing post-graduation commitments over the past few years persists.
Speaking of COVID-19 impacts, one could make the argument that increased funding and resources dedicated to the biological and life sciences as a result of the pandemic may explain the increased post-graduation commitments of life science Ph.D. recipients from 2020 to 2021.
Postgraduate Commitments for Doctorate Recipients by Demographic Measures
The NSF SED also breaks down its data by the survey participants' demographics, including whether they are international students holding temporary visas or United States Citizens or permanent residents (PR).
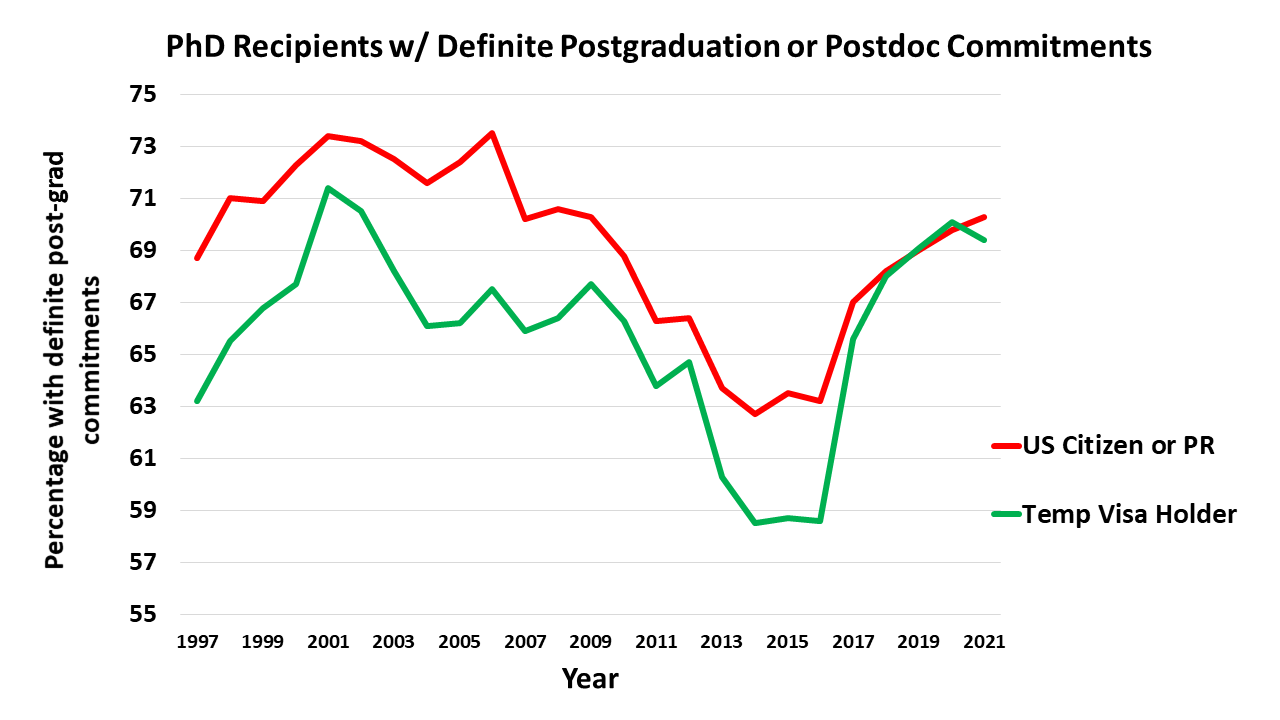
While historically temporary visa holders have had lower post-graduation commitments than US Citizens or permanent residents (PR), recently, the two groups show similar percentages. The SED data from 2018, 2019, and 2020 showed virtually identical percentages across the two groups with temporary visa holders actually having higher percentages of post-graduation commitments in 2020 (70.1% to 69.8%). In 2021, temporary visa holders showed a modest drop in percentage of post-graduation commitments to 69.4% vs US Citizens and permanent residents at 70.3%.
What can we take from these data?
The "gap" in post-graduation commitments between temporary visa holders and US Citizens or permanent residents has narrowed over the past few years. It is important to mention here that the question about post-graduation commitments focuses on commitment within the US. So, it is possible that the closing of a gap between temporary visa holders and US Citizens and permanent residents is due to more temporary visa holders choosing not to remain in the US for employment or postdoctoral training after they complete their Ph.D.
The SED data does not fully support this hypothesis, though, as the percentage of temporary visa holders who reported an intention to stay in the US after their doctorate was 71.3% in 2021, 73% in 2020, 71.2% in 2019, and 72% in 2018. Looking at the two largest groups of international students pursuing their doctorate in the US, those from India have percentage rates intending to stay in the US ranging from 87.1% in 2018 to 86.1% in 2021 with a four year average rate from 2018 to 2021 of 86.8%. Doctoral students from China have seen a decrease in intent to stay from 2020 (80.1%) to 2021 (74.4%) specifically, declining by 7.1% year-over-year. The 2021 rate for Chinese students intending to stay in the US is also below the average of the precious 6 years of SED data (2015 to 2020) of 80.7% while the rate for Indian students has remained relatively stable (average of 86.9% from 2015 to 2020 vs 86.1% in 2021). Geopolitical tensions with China may explain these differences and it will be interesting to see how the data evolves in the years to come.
Postgraduate Commitments for US Citizens or PR Doctorate Recipients by Race & Ethnicity
Across the US Citizens and permanent residents in the SED data, we can examine trends in post-graduation commitments by race and ethnicity.
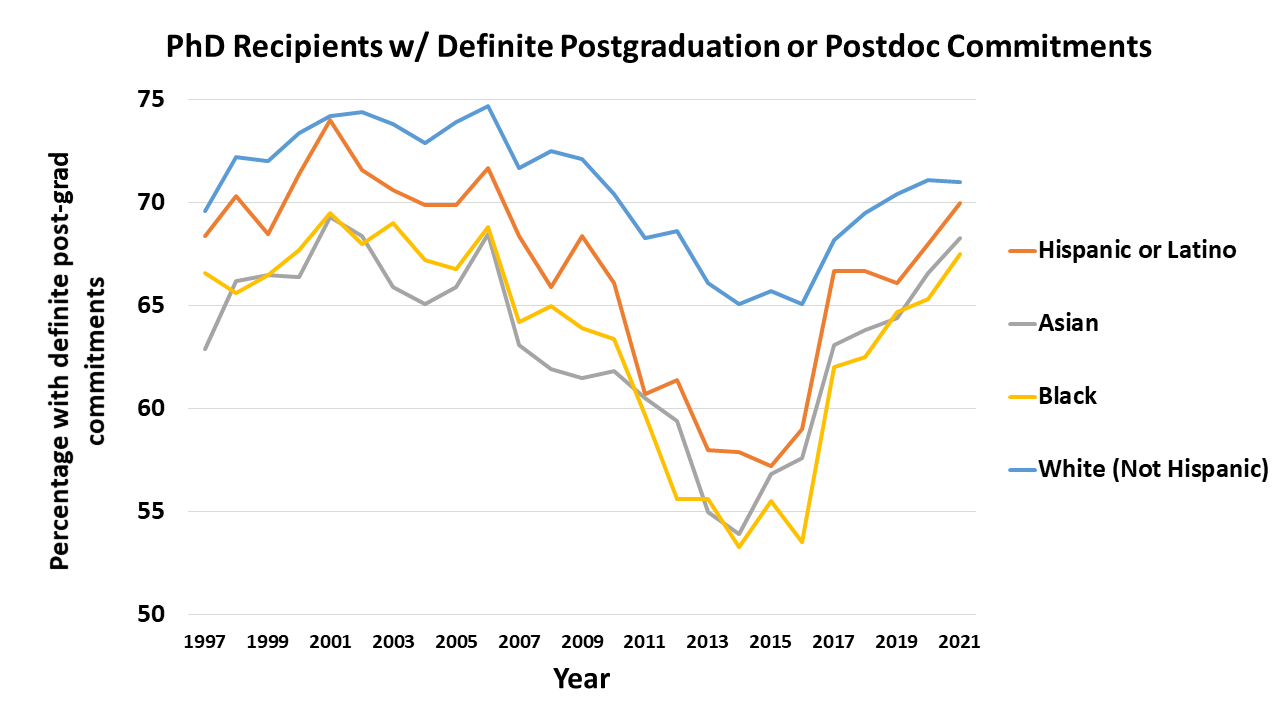
Looking at the 25 year SED data trend by the race or ethnicity of the US Citizens and permanent residents, we observe white (non-Hispanic) doctorate recipients historically have higher levels of post-graduation commitments and that Hispanic, Asian, and Black doctorate recipients showed a steeper decrease in commitments from 2005 to 2015. The dip in all groups from 2005 to approximately 2015 probably reflects the impact of 2008's global financial crisis that affected employment prospects and business investment.
Zooming in on the past five years of SED data, we can see steady increases in post-grad commitments with relatively sharp rises in those identifying as Black (8.9% increase from 2017 to 2021), Asian (8.2% increase over same period), and Hispanic or Latino (5.9% increase from 2019 to 2021). These rates compare to 4.9% increases in post-grad commitments from 2017 to 2021 and 1.9% from 2019 to 2021 across all US Citizen and permanent residents. These data seem to suggest post-graduation prospects are improving across groups and that the gap between groups has narrowed over the past five years of SED data.
Ph.D.s Pursuing Postdocs
As the data shared above reports post-graduation commitments plus postdocs, SED also looks at the data by doctorate recipients pursuing postdoctoral positions specifically.
The first insight from the percentage of doctorate recipients pursuing a postdoc is that the postdoc path is much more common in certain fields. Across all fields, the percentage of doctorate recipients pursuing a postdoc in 2021 was 41.3%. In the life sciences, the percent of Ph.D. recipients pursuing postdocs has hovered around 60% to 70% over the past 25 years. Pursuing a postdoc is also quite a common post-Ph.D. path for the physical and earth sciences (~60% historically). In contrast, the percentage of engineering doctorates pursuing a postdoc was 38.5% in 2021 vs 57.9% in the life sciences and 62.2% in the physical and earth sciences.
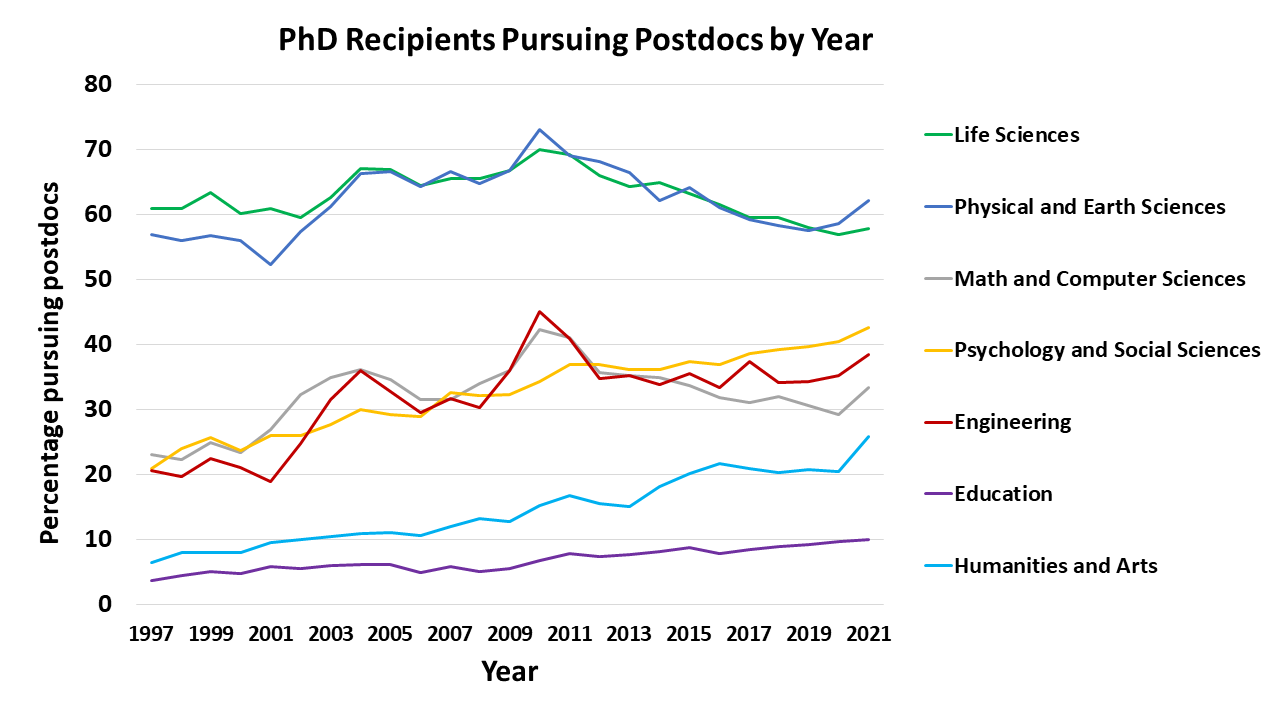
Another interesting trend over the past 25 years is the increase in engineering doctorates pursuing postdocs. The percentage rose from 20.6% in 1997 to 38.5% in 2022, a 86.9% increase over the time period studied. This compared to an overall growth in the percentage of doctorate recipients pursuing postdocs from 1997 to 2021 of 45.4%. The psychology & social sciences; education; and humanities & arts fields have seen sharp increases in the percentage of doctorate recipients pursuing postdocs since 1997 (albeit from relatively small absolute and percentage bases for education and humanities & arts specifically). Education saw a 173% and humanities & arts a 298% increase in the percentage of doctorate recipients pursuing postdocs from 1997 to 2021. The percentage increase over the same time period for psychology & social sciences doctorates was 103%. Recently, the percentage of doctorate recipients pursuing postdocs has remained relatively stable from 2017 to 2021, growing around 5.6% across all fields but actually declining by 2.7% in the life sciences.
Shifting Sectors of Recent Ph.D. Employment & Life Sciences as Case Study
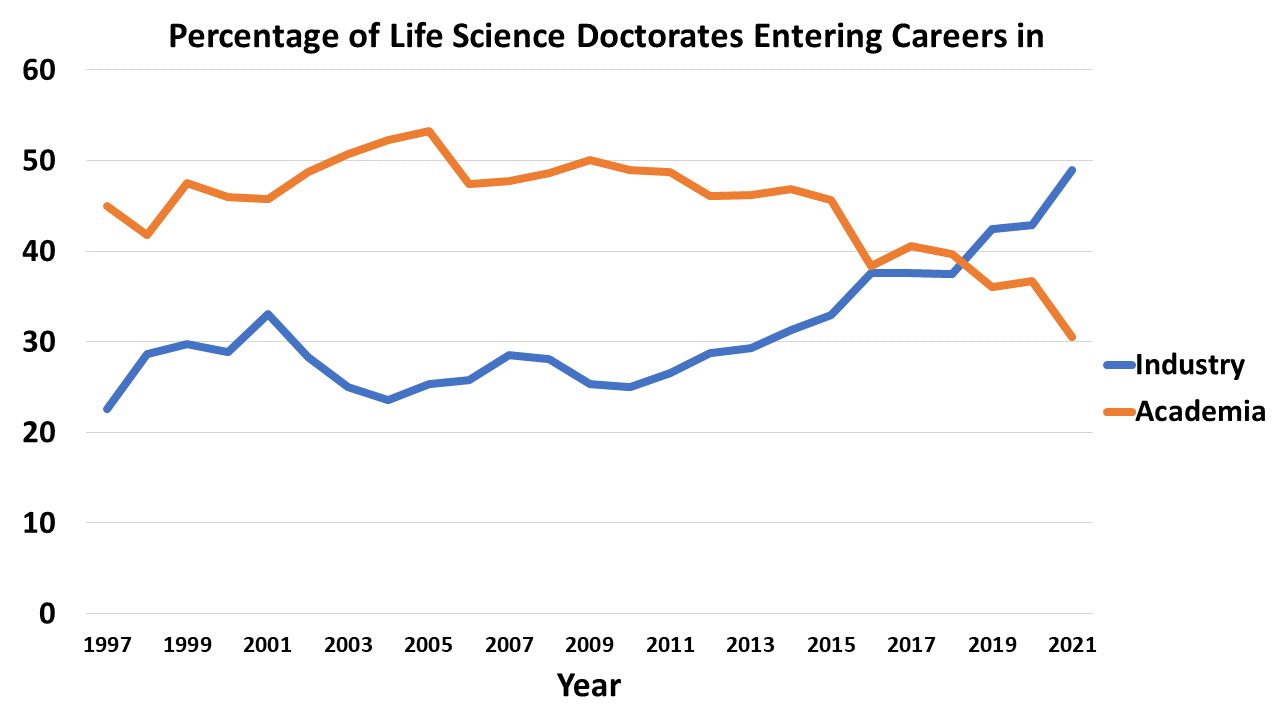
The drop in postdoc commitments in the life sciences could be pandemic related as demand for those with biological/life science expertise may have risen in the for-profit sector. Indeed, the proportion of recent life science Ph.D. recipients employed in the for-profit sector (ie, industry) continues to grow and has overtaken academia as the largest sector of employment (since 2019). The divergence in employment sectors from 2019 to 2021 is particularly striking as growth in employment of recent life science Ph.D.s in industry grew by 15.3% over the three year time period while it declined by 15.3% in the academic sector. The fact that the changes across this time horizon (and visible in the graph below) are near mirror images of one another (increasing and declining at equivalent rates) suggests the possibility that industry is replacing academia as a destination for employment of newly-minted life science Ph.D.s in recent years.
Employment sector of research doctorate recipients with definite post-graduation commitments for employment by degree field, 2021
% working in |
All Fields |
Life Sciences |
Physical & Earth Sciences |
Math & Computer Sciences |
Psych & Soc Sciences |
Engin |
Edu |
Human. & Arts |
Academia |
35.9 |
30.5 |
14.9 |
26.3 |
43.8 |
11.6 |
53.9 |
64.7 |
Industry |
43.2 |
48.9 |
70.3 |
65.8 |
27.1 |
75.8 |
8.0 |
8.8 |
Gov |
7.7 |
9.1 |
8.9 |
3.7 |
14.5 |
7.1 |
4.2 |
3.5 |
Non-profit |
6.7 |
8.7 |
3.9 |
2.8 |
9.9 |
3.7 |
6.5 |
12.8 |
Table caption: Psych & Soc Sciences = Psychology and Social Sciences; Engin = Engineering; Edu = Education; Human. = Humanities
Across all recent Ph.D. recipients, industry (for-profit companies) is the largest sector of employment of those with definite post-graduation commitments and dominates employment for those in engineering, math & computer sciences, and the physical & earth sciences. Academia is still the largest employment sector for recent Ph.D.s in the psychology & social sciences, education, and humanities & arts. Furthermore, non-profit sector work is more common in the humanities & arts, psychology & social sciences, and life sciences while government employment is more common for those with Ph.D.s in psychology & social sciences, life sciences, and the physical & earth sciences than those with Ph.D.s in other fields.
We can also observe some interesting historical trends in the employment fields of doctorate recipients over the past 5, 10, and 25 years. From 2017 to 2021, across all fields, the percentage of doctorate recipients with commitments for employment in academia decreased by 22.6%. This trend was -28.9% from 2012 to 2021 and -21.6% from 1997 to 2021. Employment in government over the same time period ranged from 5.5% to 6.9% growth. Growth in for-profit (industry) sector employment of recent doctorate recipients grew by 24.5% from 2017 to 2021, 48.5% from 2012 to 2021, and 61.8% from 1997 to 2021 across all fields and was even higher for those from the life sciences (116.4% growth from 1997 to 2021). Clearly, academia as a destination for recent doctorates is declining with industry as an increasing sector of newly-awarded Ph.D. employment.
Postdoctoral Pursuit by Citizenship Status
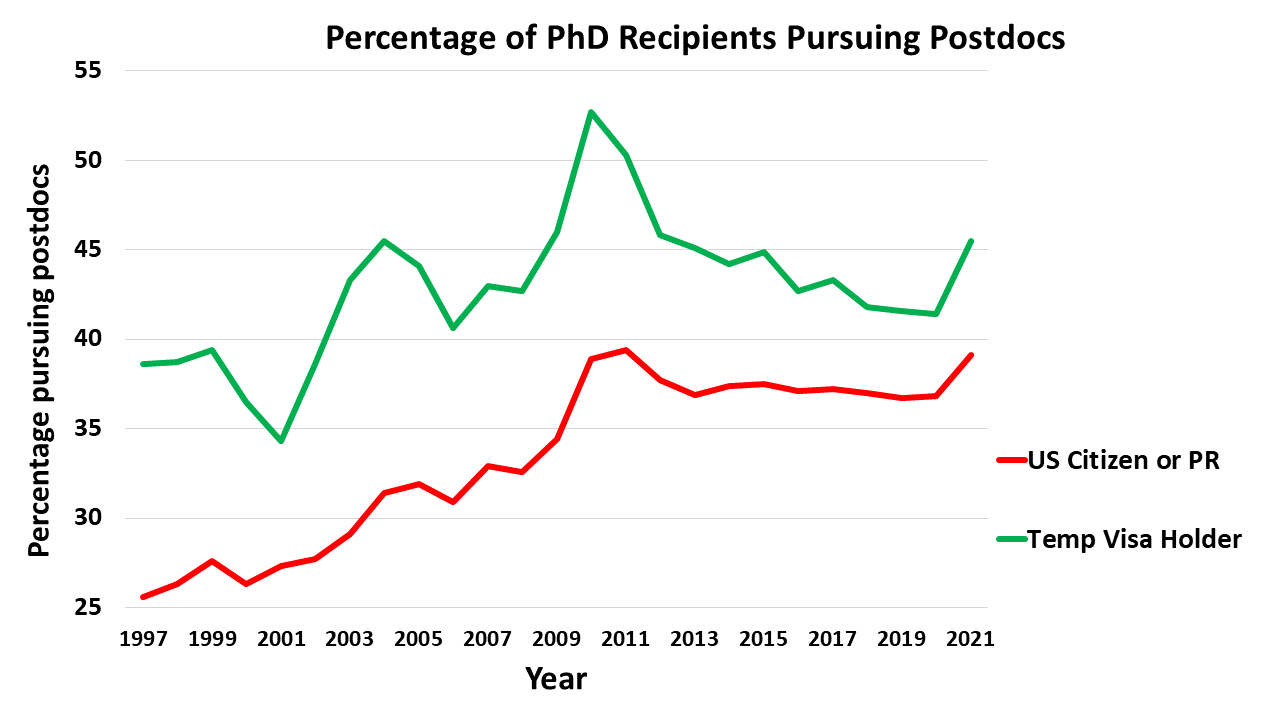
The data on doctorate recipients pursuing postdocs by citizenship status clearly indicates this path is more commonly pursued by temporary visa holders, undoubtedly due to the fact that working at a nonprofit, academic institution provides a variety of visa pathways available versus the for-profit sector (from those pursuing OPT on their student F1 visas to J1 scholar visa options and H-1B visas that are "uncapped" vs those available in the for-profit sector).
The sharp increase in postdoc pursuit in both US Citizens/PRs and temporary visa holders after 2008 suggests a pivot during and after the great financial crisis of that year which slowed the economy and limited career opportunities in the for-profit and government sectors. Postdoctoral positions were potentially "safe places" to ride out the rough economy. And while the percentage pursuing postdocs dropped relatively steeply for temporary visa holders after 2010, the rates remained elevated for US Citizens and permanent residents from 2011 to 2021 (37.5% pursuing postdocs) and rates during this eleven-year time span were 30% higher than that seen from 1997 to 2007 (28.8% pursuing postdocs).
We also see a bit of sign of the COVID-19 pandemic's impact in the data from 2020 to 2021 where the percentage of US Citizens or permanent residents pursuing postdocs increased by 6.25% year-over-year while the increase was 9.9% for temporary visa holders. It will be interesting to see if the 2022 SED data shows that COVID's impact on this metric subsided or persisted.
Postdoc Pursuit of US Citizens & Permanent Residents by Race & Ethnicity
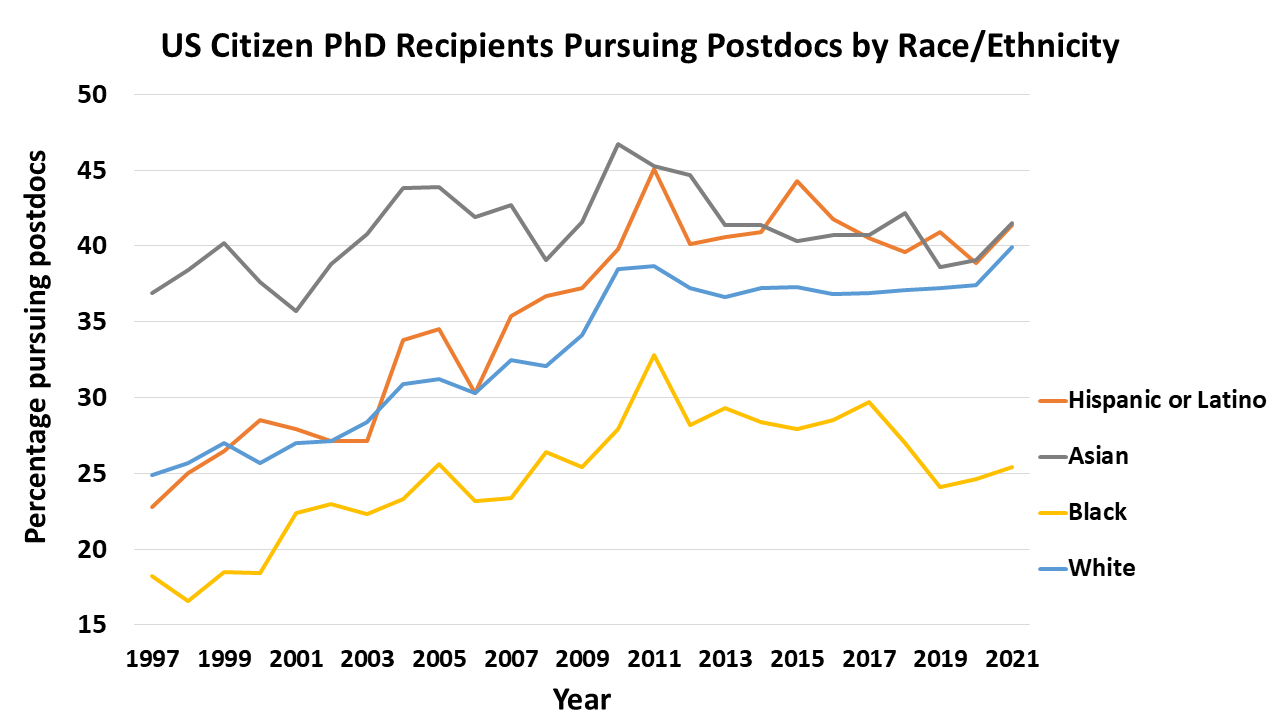
There are vast differences in the percentage of US Citizens and permanent resident doctorate recipients pursuing a postdoc by their race/ethnicity. Rates have historically been highest in those identifying as Asian and the rates have climbed steadily for White, Non-Hispanic individuals and those identifying as Hispanic. For Black survey respondents, the percentage of doctorate recipients pursuing postdocs in 2021 stood at 25.4%. This compared to a rate of 39.9% in White, Non-Hispanic; 41.5% in Asian; and 41.4% in Hispanic respondents.
I will turn to 2021 Survey of Doctorate Recipients (SDR) data to further explore postdoctoral demographics as well as compare the demographics of recent Ph.D. recipients (data from the SED) to those in postdoctoral positions (data from the SDR).
I will turn to 2021 Survey of Doctorate Recipients (SDR) data to further explore postdoctoral demographics as well as compare the demographics of recent Ph.D. recipients (data from the SED) to those in postdoctoral positions (data from the SDR).
Survey of Doctoral Recipients Postdoc Data
The 2021 SDR data reports demographic data on a wide range of U.S. residing doctoral scientists and engineers (ie, not just recent Ph.D. graduates), including those reporting their current position as being in a postdoctoral appointment.
It also reports the percentage of individuals employed as postdocs by years since doctorate by broad field of doctorate. While many institutions limit the length of a postdoc and/or define a postdoc as being a position that should not be used for individuals more than 5 years from their terminal degree, the SDR data shows a non-negligible percentage of postdocs are 6 or more years from receiving their Ph.D.s.
It also reports the percentage of individuals employed as postdocs by years since doctorate by broad field of doctorate. While many institutions limit the length of a postdoc and/or define a postdoc as being a position that should not be used for individuals more than 5 years from their terminal degree, the SDR data shows a non-negligible percentage of postdocs are 6 or more years from receiving their Ph.D.s.
Years Since Ph.D. |
All Postdocs |
Life Sciences |
Physical Sciences |
Engineering |
5 years or less |
81.8% |
75.5% |
87.4% |
87.3% |
6-10 years |
15.7% |
21.6% |
10.8% |
11.4% |
11 years or more |
2.6% |
2.9% |
1.8% |
1.3% |
In raw numbers, nearly 5,000 of the 27,150 postdocs surveyed across all fields in the 2021 SDR were in their postdoc more than 5 years after receiving their doctorate degree. It is notable that nearly a quarter of those postdocs with doctorates in the life sciences were in postdocs 6 or more years from receiving their degree, a rate (24.5%) nearly twice that seen in the physical sciences (12.6%) and engineering (12.7%).
Across all individuals 5 or fewer years from their Ph.D., 15.7% (22,200 of 141,750) were employed as postdocs and this percentage rose to 28.5% for the biological, agricultural, and environmental life sciences and 22% for the physical sciences. For those who earned an engineering doctorate within the last 5 years, only 10.5% were employed as postdocs. Across all science doctorates surveyed in the 2021 SDR, 19.7% of postdocs were 5+ years from their Ph.D. and this percentage rose to 24.1% in the biological, agricultural, and environmental life sciences.
So, the postdoc position is more common in certain fields (as evidenced in the SED data presented earlier and SDR data just covered) and the length of time an individual remains in the postdoc also varies by field.
US Postdocs by Citizenship Status
Across all those reporting they were in postdoctoral positions in the 2021 SDR survey (n=27,150), 53.2% were US Citizens while 46.8% were non-Citizens. Of engineering doctorate holders in postdocs surveyed, 70.9% were non-US Citizens. Mathematics and statistics (64.7%) and physical sciences (54.1%) postdocs were also majority comprised of non-US Citizens. In the biological, agricultural, and environmental life sciences 60.8% of postdocs surveyed were US Citizens. The percentage of postdocs who were US Citizens was also high in the social sciences (66.7%), computer and information sciences (66.7%), and psychology (82.4%).
US Postdocs by Sex
Across all fields, postdocs are 58.6% male. In engineering, nearly 3/4 of postdocs are male (74.7%) while the ratio is 2/3 for the physical sciences (66.7% male). Over 3/4 of mathematics and statistics doctorates in postdoctoral positions are male (76.5%). Those with doctorates in the biological, agricultural, and environmental life sciences working in postdocs are 53.9% male.
Ethnicity of US Postdocs vs Doctorate Recipients
The SED reports on the race and ethnicity of those earning doctorates in the US each year. Looking at the SED from 2001 and 2021, we observe growth in the share of Ph.D.s awarded to those identifying as Asian, Black, and Hispanic or Latino with doubling of Ph.D.s awarded in the later group from 2001 to 2021.
The SED reports on the race and ethnicity of those earning doctorates in the US each year. Looking at the SED from 2001 and 2021, we observe growth in the share of Ph.D.s awarded to those identifying as Asian, Black, and Hispanic or Latino with doubling of Ph.D.s awarded in the later group from 2001 to 2021.
Race & Ethnicity of US Citizens or Permanent Residents Doctoral Recipients: 2001 vs 2021
Race/Ethnicity |
2001 |
2021 |
% Change, 2001 to 2021 |
Hispanic/Latino |
4.4% |
9.0% |
+105% |
Black |
5.7% |
7.7% |
+37% |
Asian |
7.4% |
9.5% |
+28% |
White |
76.8% |
67.4% |
-12% |
Race & Ethnicity of Recent Ph.D. Recipients vs Postdoc Population - Identifying Gaps
In the SDR data from 2021, 6.3% of those in US postdocs identified as Hispanic/Latino, 3.1% as Black, 41.3% as Asian, and 47.2% as White.
If we compare 2021 SED to SDR data we see that while 9% of doctorate recipients were Hispanic/Latino, 6.3% of postdocs identified as such, resulting in a ratio of postdoc/PhD recipients identifying as this ethnic group of 0.7 (the postdoc composition of this group is 30% less than its composition in the PhD recipient group). Calculating a similar metric for other races/ethnicities, we get ratios ranging from 0.4 for Black to 4.3 for Asian (and 0.7 for White). Given the SDR data on postdocs does not breakdown race/ethnicity by US Citizenship status, we can't perfectly map it to the SED data.
Looking at the SED data more closely, it reports Ph.D. recipient data by race/ethnicity and US citizenship status, showing that in 2021 of those identifying as Asian, 20.7% were also US Citizens or permanent residents and in total 27.9% of all Ph.D. recipients from US universities identified as Asian in 2021. If we use the 27.9% of all doctorate recipients in our ratio of postdoc/PhD recipients for Asians, we get a ratio of 1.5 or nearly double that of While recipients.
What is also obvious in this rather crude analysis of postdoc/PhD recipient population proportion is that Black doctorate recipients are not in postdoctoral appointments at the same rates as White, Hispanic/Latino, or Asian individuals and that Asians appear over-represented in postdoctoral positions relative to other ethnic groups.
Median Salaries of Recent Ph.D. Recipients by Doctorate Field and Employment Sector
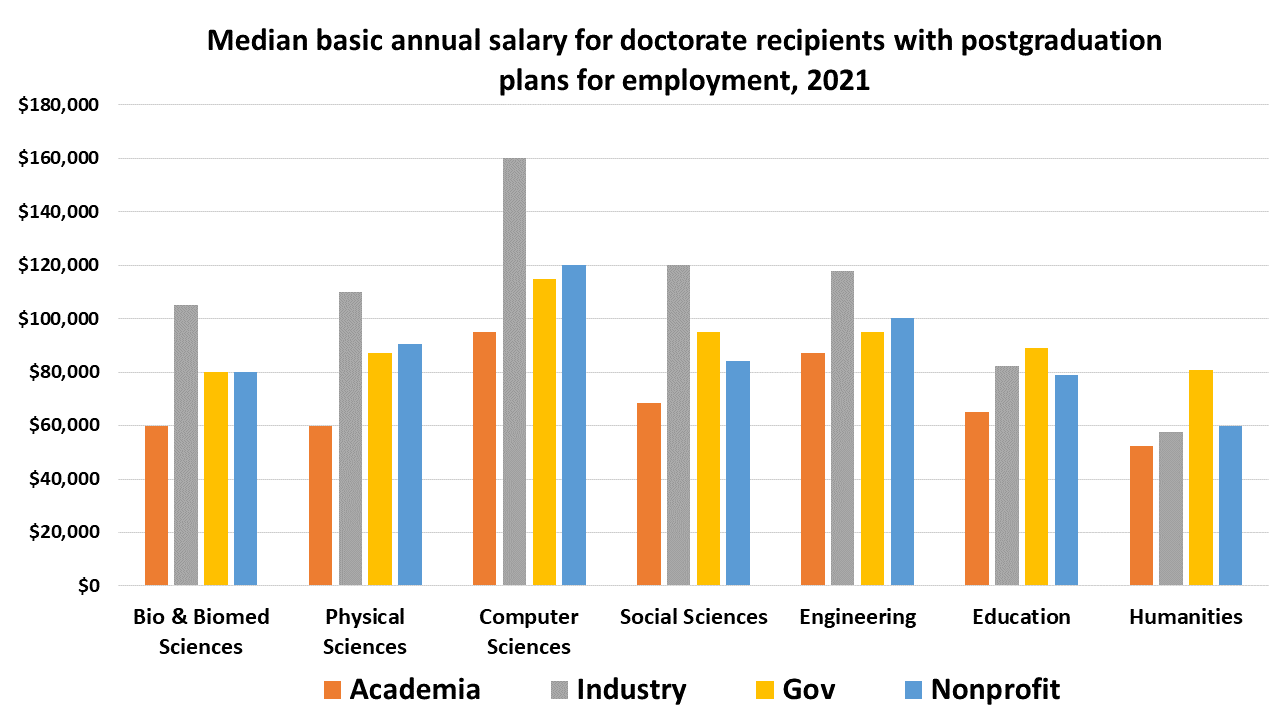
The 2021 SED data reports median salaries for doctorate recipients (ie, newly-awarded Ph.D.s) by employment sector and field of degree. Collapsed across all fields, the median salary for a doctorate recipient in 2021 was $90,000 and ranged from $68,000 in academia to $115,000 for industry careers. There was also large divergence by Ph.D. field with computer and information sciences doctorates earning a median of $145,000 across all employment sectors in 2021 vs $55,000 in the humanities.
Historically, from 2017 to 2021, median salaries for doctorate recipients employed in academia grew at 7.94% while those in government grew at 9.5% and industry grew at 15.0%.
Postdoc salary has become a hot topic in recent months and the 2021 SED data also reports median postdoc salaries by Ph.D. field.
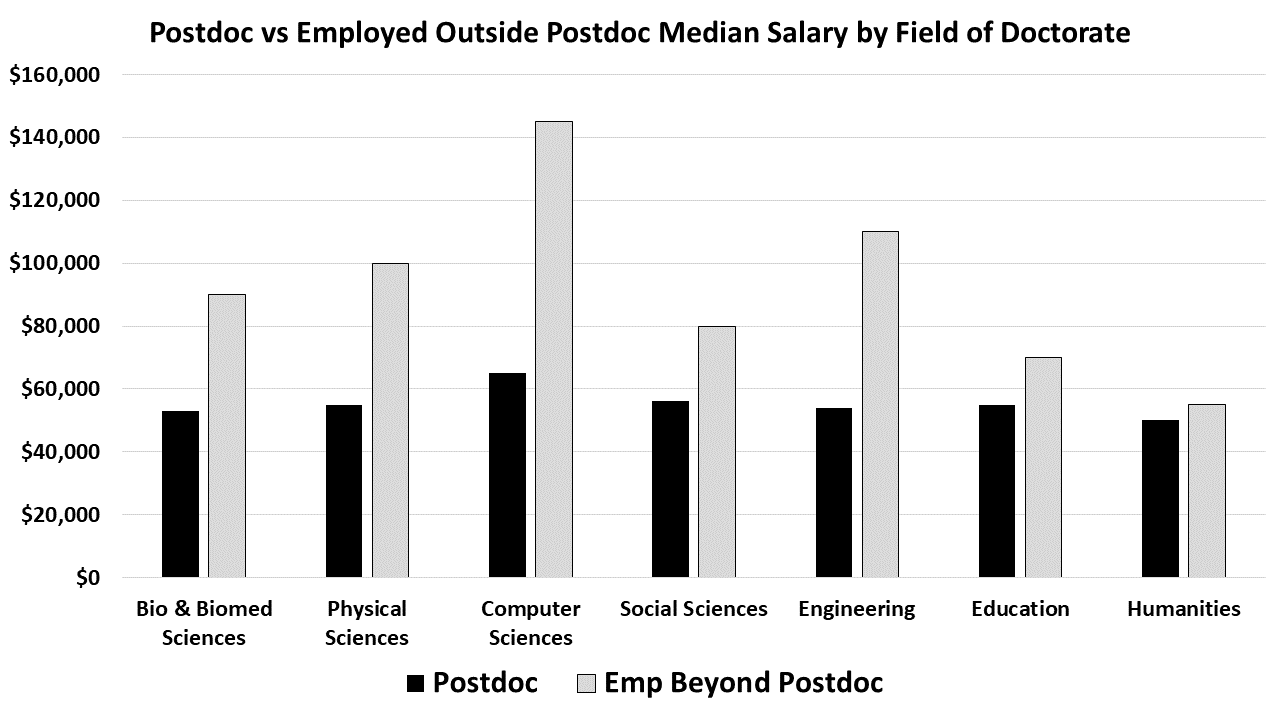
The median salary of a recent computer and information sciences doctorate working not as a postdoc is 123% more than the median postdoc salary for someone from this field. The gap is narrower in other fields but across all fields a position outside a postdoc has a median salary 68% higher than a postdoc median salary.
Median Salary "Growth" by Year Since Doctorate
The SDR data from 2021 allows us to get a better glimpse at median annual salaries across a range of fields and by seniority of respondents (years since doctorate).
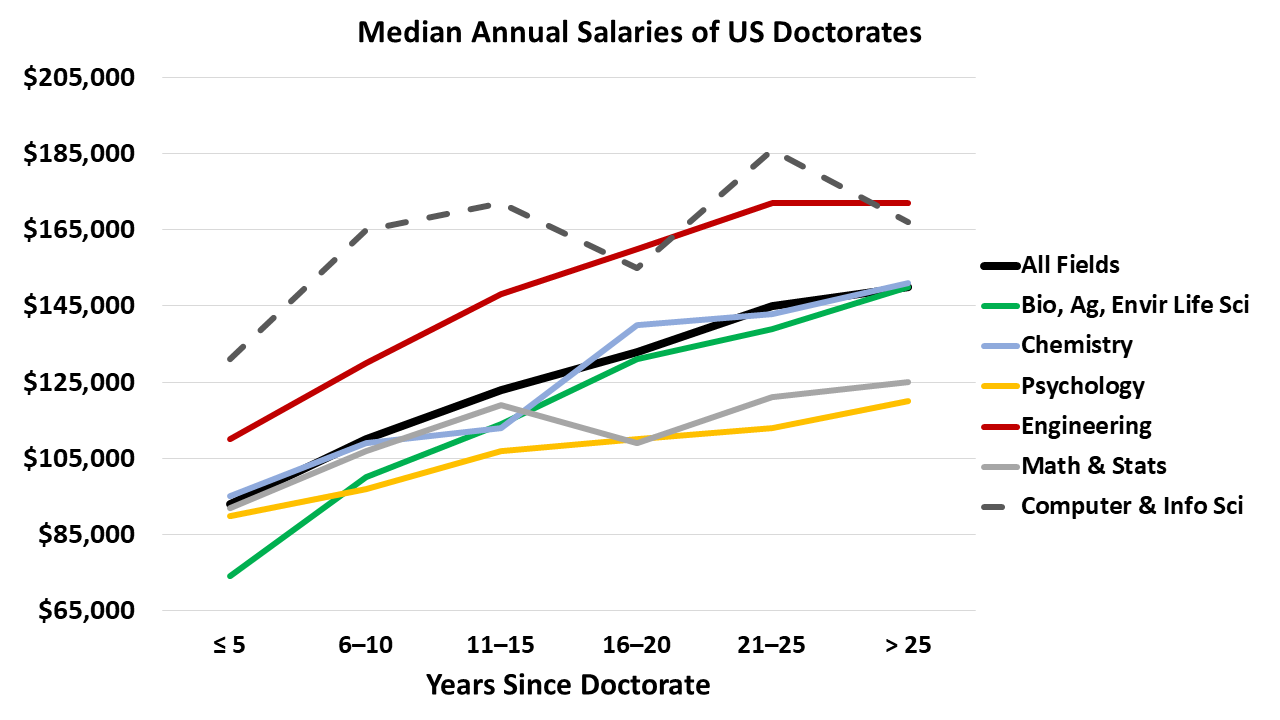
Across all fields, you can see a clear upward trend in the median annual salaries of doctorate recipients as they become more senior (are further out from receiving their degree). Those with engineering doctorates consistently out-earn most of the other sciences while the computer and information science doctorates (dashed gray line, above), show more volatility in the upward trend of earnings as they move further from receiving their degree. Math and statistics also shows a small dip in earnings trajectory for the 16-20 years from degree group. Given these data are from the 2021 SDR, the time period in which that group earned their degrees was most likely 2001-2005 and could reflect the remnants of the "dot-com bust" of the early 2000s where the NASDAQ-100 (an index of mostly US technology stocks) bottomed in October 2002.
Median Salary of Faculty by Field of Doctorate and Rank
The 2021 SDR also reports median salaries for faculty positions of respondents by field of doctorate and faculty rank (assistant, associate, or full professor).
The Rise of "Other" Work as a Primary Activity of Employed Ph.D.s
The SDR data asks respondents to report on their primary work activity across several categories including research & development (R&D); teaching; professional services; & management, sales, or administration. Many recent Ph.D. recipients think that the primary activity they will perform is R&D or teaching but the SDR data show that the percentage of individuals reporting those two activities as their primary work activity has remained flat or declined over the past few years.
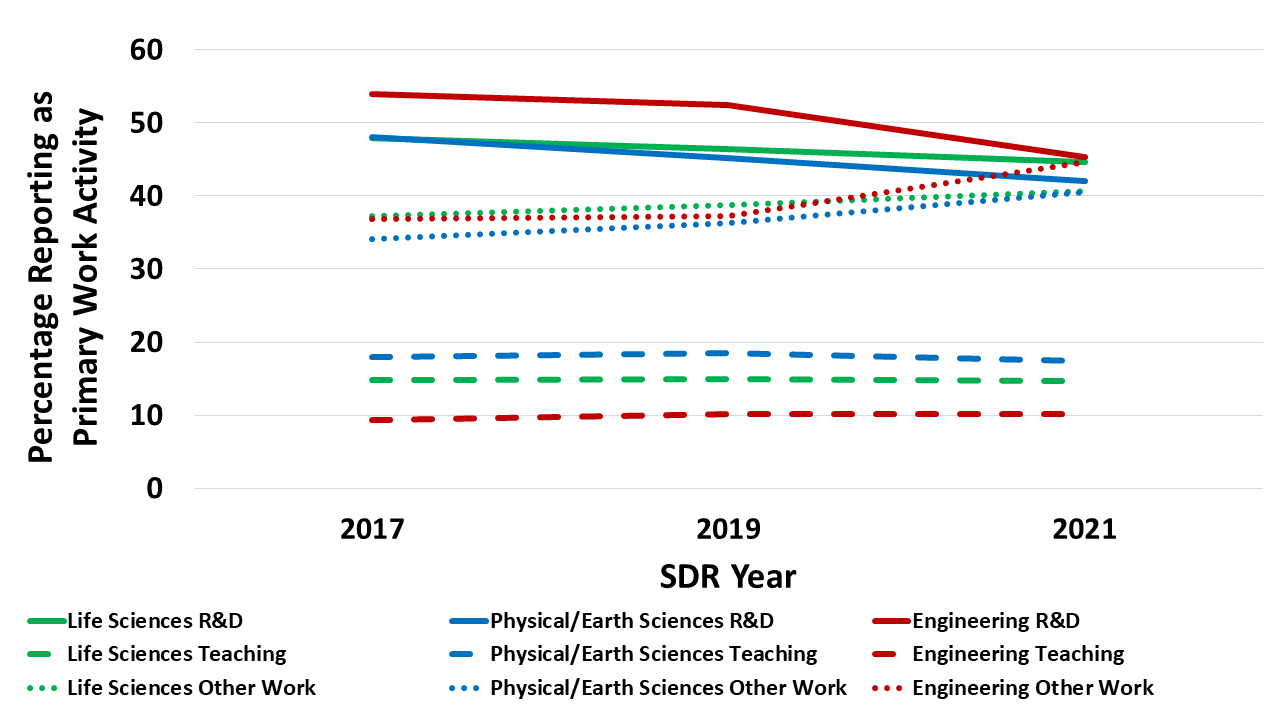
The dotted lines in the graph above reflect the percentage of SDR respondents in 2017, 2019, and 2021 (three most recent surveys as the SDR is collected every two years) who indicated a role other than R&D and teaching as their primary work activity. You can see across three broad Ph.D. fields (life sciences, physical/earth sciences, and engineering) the percentage reporting "other" work as their primary activity has increased. In fact, this percentage of those reporting "other work" is equivalent to those reporting R&D as their primary work activity in engineering and physical/earth sciences and approaching equivalency in the life sciences. In other words, more Ph.D.s are working in roles where their primary activity is something other than research/development and/or teaching.
What are some of these other primary work activities?
The 2021 SDR data found 21.3% of life science Ph.D.s's primary work activity is in management, sales, or administration with another 11.2% reporting professional services. Physical/earth sciences Ph.D.s reported a similar level of primary work in management, sales, or administration (21.2%). This percentage was 20.3% for those with engineering Ph.D.s. So, roughly 1 in 5 Ph.D.s in science and engineering work primarily in management, sales, or administration. This finding suggests the importance of Ph.D.s thinking about how they can build transferrable skills like communication, leadership, and project management to help set themselves up for success in these areas.
Takeaways from the 2021 NSF Data
While a lot of data were shared in this piece, I have only scratched the surface on the wealth of information available through NSF. You can explore some of their reports on the 2021 SED as well as COVID impacts when comparing 2019 to 2021 SDR data to learn more about trends in the Ph.D. workforce.
Some key insights (and my thoughts/comments) from the data in this piece include:
I thank the NSF for collecting and sharing these data. Leveraging this information and examining longitudinal trends helps empower both prospective and current graduate students, postdoctoral scholars, faculty, and administrators with knowledge of the state of the Ph.D. labor market and evolving scientific workforce. Only through knowing where we are currently at in terms of the demographics of the scientific workforce and the possibilities of what is out there for areas of Ph.D. employment can we chart a path to where we want to go both individually and as a society.
Some key insights (and my thoughts/comments) from the data in this piece include:
- Little apparent effect of the COVID-19 pandemic on Ph.D. "post-graduation" commitments suggesting Ph.D. talent is often in demand (though postdoc pursuit may have spiked a bit in some fields as a result of the pandemic).
- Relative growth in the percentage of recent Ph.D.s with definite post-graduation or postdoc commitments over the last few years (2017 - 2021) - Perhaps institutions are doing a better job connecting grad students with resources and the knowledge to navigate the job market proactively?
- The gap between temporary visa holders and US Citizens and permanent residents with definite post-graduation commitments has narrowed over the past few years (since 2018), this could be the result of more openness from employers to sponsor work visas or more international students not wanting to stay in the US for employment (w/ some early signs of this from Chinese graduate students).
- Gaps in US Citizens or permanent residents with post-graduation commitments from different ethnic and racial groups narrowing over the past few years, which may suggest better access and dissemination of information on the job search process that might have been more implicit in the past (ie, uncovering the hidden curriculum).
- A decline in the number of individuals pursuing postdoctoral positions in the life sciences and physical & earth sciences over the years but an increase in the percentages of engineering, psychology & social sciences, and education doctorates pursuing postdocs.
- "Peak postdoc" may have been reached in the life sciences and physical & earth sciences around 2010.
- Potentially, higher scholarly productivity expectations has resulted in a postdoctoral position becoming more common in other academic fields.
- Relatively low levels of Black Ph.D. recipients pursuing postdoctoral training.
- Is the way we hire postdocs (mostly via networking) hurting certain under-represented groups and/or is the academic career path of less interest to these individuals?
- A sizeable number of individuals are in postdoctoral positions 6+ years after receiving their Ph.D., especially in the life sciences.
- While a postdoc is supposed to be a relatively short-term, temporary training position, the data suggest some individuals can be in them many years after their Ph.D. was awarded.
- The for-profit sector (industry) as the main employment sector of most recent Ph.D.s.
- Better pay and less perceived job stress may be pushing Ph.D.s to pursue careers outside higher education/academia.
- Differences in median salaries for Ph.D. recipients working in different sectors of employment.
- Data on median salaries across employment sectors as well as for postdoctoral and faculty positions by field of doctorate can be instructive as individuals make decisions on what fields to pursue in graduate school and/or which career path(s) to pursue, post-Ph.D..
- The rise of primary work activities beyond teaching and research & development since 2019, signaling a need for Ph.D.s to develop transferable skills like leadership, project management, & communication.
I thank the NSF for collecting and sharing these data. Leveraging this information and examining longitudinal trends helps empower both prospective and current graduate students, postdoctoral scholars, faculty, and administrators with knowledge of the state of the Ph.D. labor market and evolving scientific workforce. Only through knowing where we are currently at in terms of the demographics of the scientific workforce and the possibilities of what is out there for areas of Ph.D. employment can we chart a path to where we want to go both individually and as a society.
Further Reading from the Blog
See also:
Explore more data from NSF's National Center for Science and Engineering Statistics
- Ph.D. Recipients' Employment Trends: Insights from National Science Foundation Data
- Ph.D. Employment Trends - Insights from NSF Survey of Doctorate Recipients
- Factors That Affect Career Choice and Diversity in Science
- The Challenges of Being an International Researcher: Implications for Advanced Degree Labor Markets
See also:
Explore more data from NSF's National Center for Science and Engineering Statistics
 RSS Feed